| Red | Green | Blue | |
| z | 17.64 | ||
| znorm | Inf | ||
| sky | -NaN | -NaN | -NaN |
| S/N | 22.8 | 40.3 | 42.7 |
| S/N(c) | 0.0 | 0.0 | 0.0 |
| SN(E/C) |
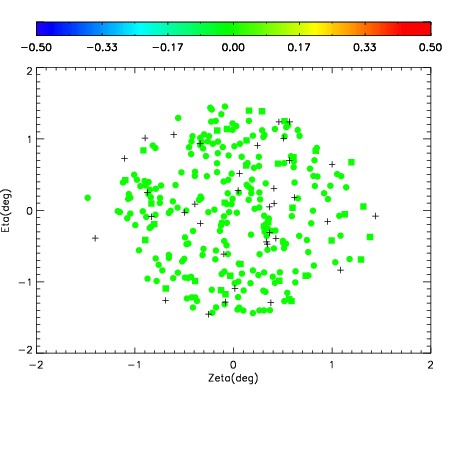
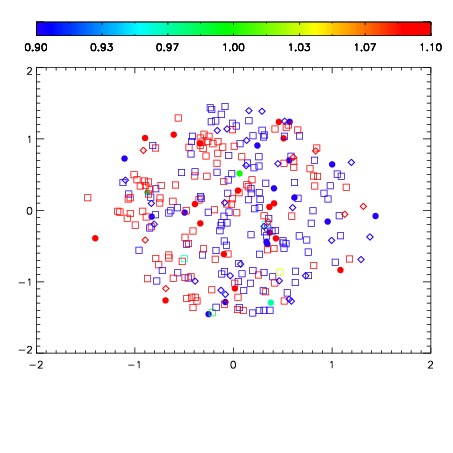
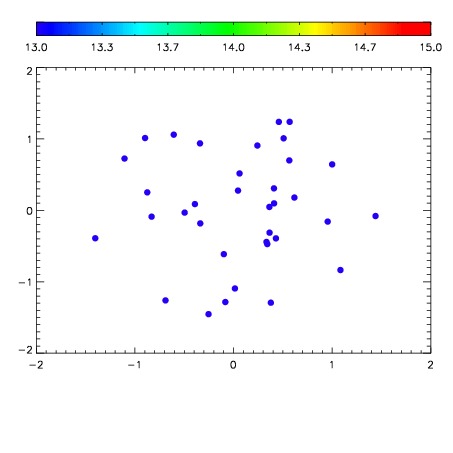

| Frame | Nreads | Zeropoints | Mag plots | Spatial mag deviation | Spatial sky 16325A emission deviations (filled: sky, open: star) | Spatial sky continuum emission | Spatial sky telluric CO2 absorption deviations (filled: H < 10) | |||||||||||||||||||||||
| 0 | 0 |
|
|
|
|
|
|
| IPAIR | NAME | SHIFT | NEWSHIFT | S/N | NAME | SHIFT | NEWSHIFT | S/N |
| 0 | 03740025 | 0.499987 | 0.00000 | 18.7712 | 03740023 | 0.00000 | 0.499987 | 18.6586 |
| 1 | 03740029 | 0.496129 | 0.00385800 | 18.8406 | 03740030 | 0.00224441 | 0.497743 | 18.8471 |
| 2 | 03740028 | 0.494820 | 0.00516701 | 18.8402 | 03740027 | 8.40343e-05 | 0.499903 | 18.8448 |
| 3 | 03740024 | 0.497664 | 0.00232300 | 18.8030 | 03740026 | 0.000212850 | 0.499774 | 18.7294 |