| Red | Green | Blue | |
| z | 17.64 | ||
| znorm | Inf | ||
| sky | -Inf | -Inf | -Inf |
| S/N | 29.0 | 49.5 | 52.5 |
| S/N(c) | 0.0 | 0.0 | 0.0 |
| SN(E/C) |
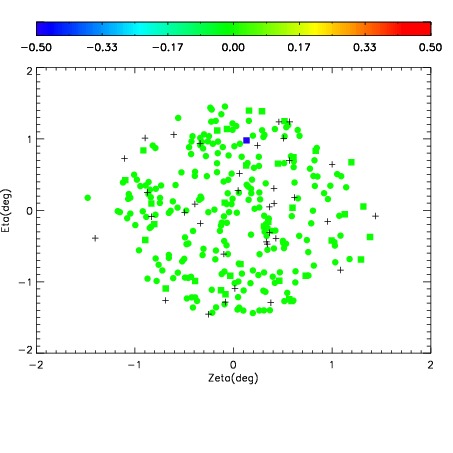
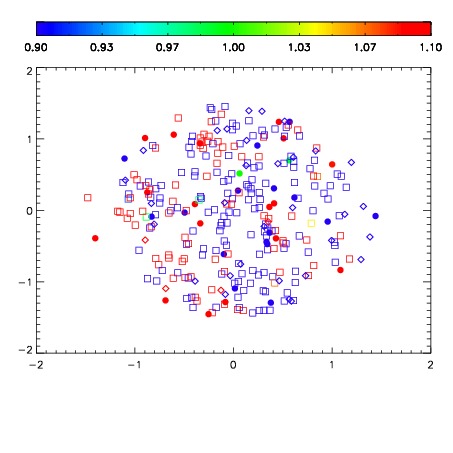
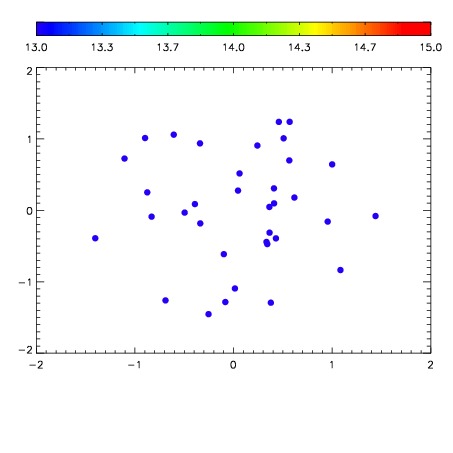

| Frame | Nreads | Zeropoints | Mag plots | Spatial mag deviation | Spatial sky 16325A emission deviations (filled: sky, open: star) | Spatial sky continuum emission | Spatial sky telluric CO2 absorption deviations (filled: H < 10) | |||||||||||||||||||||||
| 0 | 0 |
|
|
|
|
|
|
| IPAIR | NAME | SHIFT | NEWSHIFT | S/N | NAME | SHIFT | NEWSHIFT | S/N |
| 0 | 04280036 | 0.496142 | 0.00000 | 19.1551 | 04280034 | -0.000764278 | 0.496906 | 19.1703 |
| 1 | 04280035 | 0.490481 | 0.00566101 | 19.1781 | 04280037 | -5.69694e-05 | 0.496199 | 19.1775 |
| 2 | 04280032 | 0.494770 | 0.00137201 | 19.1030 | 04280033 | 0.00144251 | 0.494699 | 19.1586 |
| 3 | 04280031 | 0.490054 | 0.00608799 | 19.0844 | 04280030 | 0.00000 | 0.496142 | 19.0560 |