| Red | Green | Blue | |
| z | 17.64 | ||
| znorm | Inf | ||
| sky | -Inf | -NaN | -Inf |
| S/N | 26.2 | 43.4 | 49.4 |
| S/N(c) | 0.0 | 0.0 | 0.0 |
| SN(E/C) |
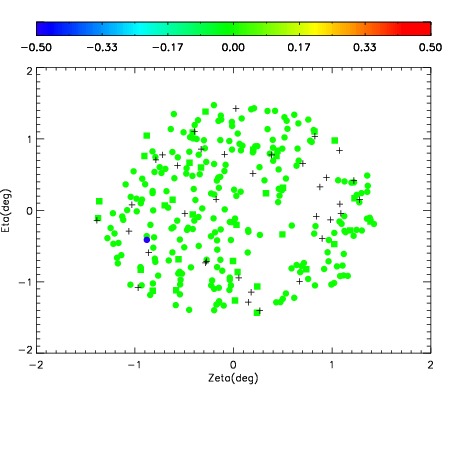
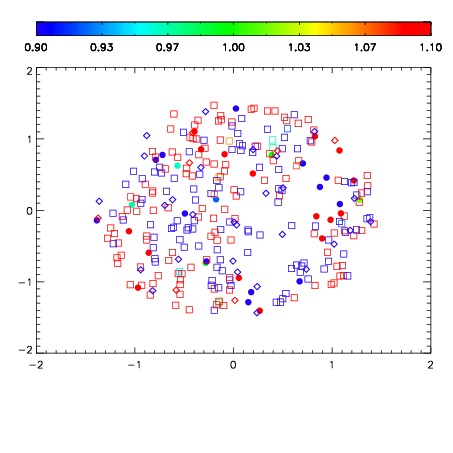
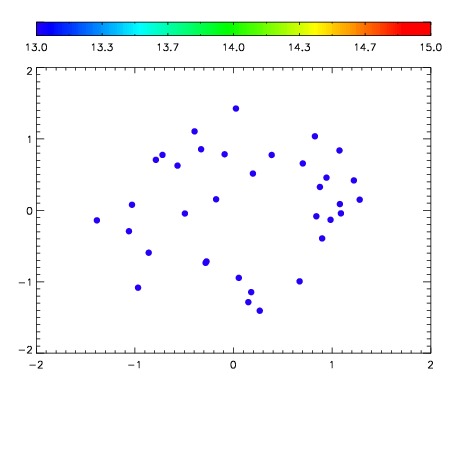

| Frame | Nreads | Zeropoints | Mag plots | Spatial mag deviation | Spatial sky 16325A emission deviations (filled: sky, open: star) | Spatial sky continuum emission | Spatial sky telluric CO2 absorption deviations (filled: H < 10) | |||||||||||||||||||||||
| 0 | 0 |
|
|
|
|
|
|
| IPAIR | NAME | SHIFT | NEWSHIFT | S/N | NAME | SHIFT | NEWSHIFT | S/N |
| 0 | 04290040 | 0.506518 | 0.00000 | 19.0032 | 04290041 | 0.00130318 | 0.505215 | 19.0205 |
| 1 | 04290039 | 0.505410 | 0.00110799 | 18.9788 | 04290037 | -0.000888576 | 0.507407 | 18.9830 |
| 2 | 04290036 | 0.504598 | 0.00191998 | 18.9596 | 04290038 | 0.00143610 | 0.505082 | 18.9500 |
| 3 | 04290035 | 0.504189 | 0.00232899 | 18.9336 | 04290034 | 0.00000 | 0.506518 | 18.9256 |