| Red | Green | Blue | |
| z | 17.64 | ||
| znorm | Inf | ||
| sky | -Inf | -Inf | -Inf |
| S/N | 31.6 | 56.9 | 60.9 |
| S/N(c) | 0.0 | 0.0 | 0.0 |
| SN(E/C) |
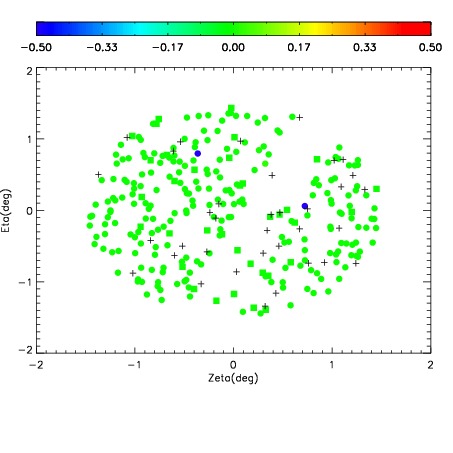
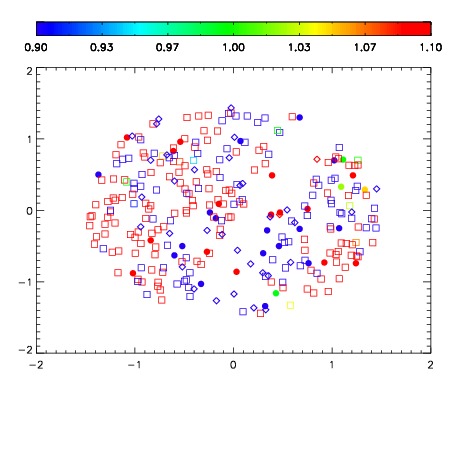
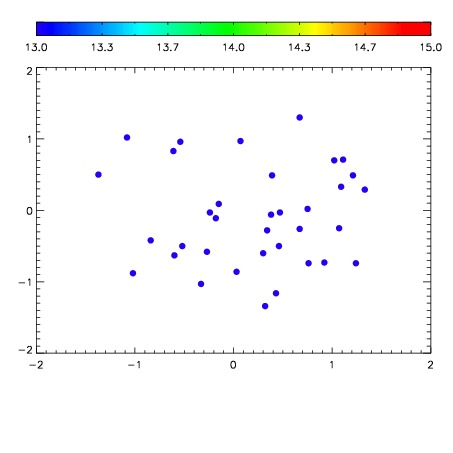

| Frame | Nreads | Zeropoints | Mag plots | Spatial mag deviation | Spatial sky 16325A emission deviations (filled: sky, open: star) | Spatial sky continuum emission | Spatial sky telluric CO2 absorption deviations (filled: H < 10) | |||||||||||||||||||||||
| 0 | 0 |
|
|
|
|
|
|
| IPAIR | NAME | SHIFT | NEWSHIFT | S/N | NAME | SHIFT | NEWSHIFT | S/N |
| 0 | 10900061 | 0.518322 | 0.00000 | 18.9124 | 10900066 | 0.000456746 | 0.517865 | 18.9696 |
| 1 | 10900068 | 0.517140 | 0.00118202 | 19.0240 | 10900067 | 0.000745589 | 0.517576 | 19.0027 |
| 2 | 10900065 | 0.517653 | 0.000669003 | 18.9832 | 10900063 | -0.000633573 | 0.518956 | 18.9892 |
| 3 | 10900064 | 0.517244 | 0.00107801 | 18.9636 | 10900062 | -0.00149639 | 0.519818 | 18.9779 |
| 4 | 10900060 | 0.517837 | 0.000485003 | 18.8497 | 10900059 | -0.000356822 | 0.518679 | 18.8912 |
| 5 | 10900057 | 0.517763 | 0.000558972 | 18.8187 | 10900058 | -0.00140730 | 0.519729 | 18.8898 |
| 6 | 10900056 | 0.517307 | 0.00101501 | 18.8181 | 10900055 | 0.00000 | 0.518322 | 18.8496 |