| Red | Green | Blue | |
| z | 17.64 | ||
| znorm | Inf | ||
| sky | -Inf | -Inf | -Inf |
| S/N | 34.6 | 60.3 | 63.9 |
| S/N(c) | 0.0 | 0.0 | 0.0 |
| SN(E/C) |
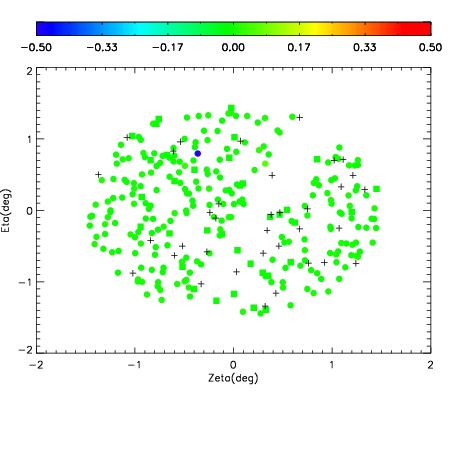
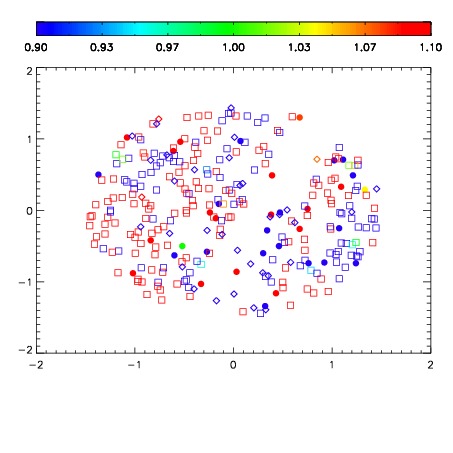
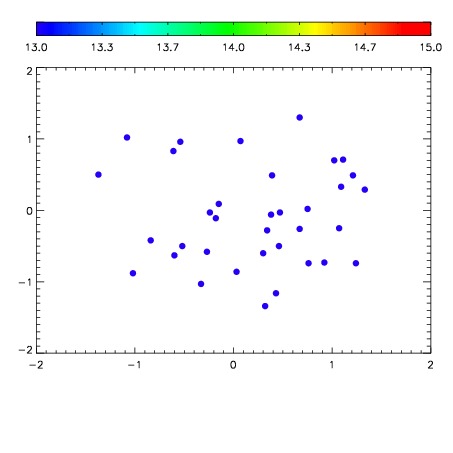

| Frame | Nreads | Zeropoints | Mag plots | Spatial mag deviation | Spatial sky 16325A emission deviations (filled: sky, open: star) | Spatial sky continuum emission | Spatial sky telluric CO2 absorption deviations (filled: H < 10) | |||||||||||||||||||||||
| 0 | 0 |
|
|
|
|
|
|
| IPAIR | NAME | SHIFT | NEWSHIFT | S/N | NAME | SHIFT | NEWSHIFT | S/N |
| 0 | 10950021 | 0.502369 | 0.00000 | 19.0845 | 10950022 | 0.000911467 | 0.501458 | 19.0979 |
| 1 | 10950020 | 0.501470 | 0.000898957 | 19.0743 | 10950019 | 0.00140330 | 0.500966 | 19.0658 |
| 2 | 10950024 | 0.500773 | 0.00159597 | 19.0671 | 10950023 | 0.00134379 | 0.501025 | 19.0651 |
| 3 | 10950017 | 0.500562 | 0.00180697 | 19.0313 | 10950018 | 0.000702172 | 0.501667 | 19.0638 |
| 4 | 10950016 | 0.500235 | 0.00213397 | 19.0124 | 10950014 | 0.00108573 | 0.501283 | 19.0133 |
| 5 | 10950012 | 0.499548 | 0.00282100 | 18.9636 | 10950015 | 0.00135130 | 0.501018 | 18.9905 |
| 6 | 10950013 | 0.499355 | 0.00301400 | 18.9632 | 10950011 | 0.00000 | 0.502369 | 18.9694 |