| Red | Green | Blue | |
| z | 17.64 | ||
| znorm | Inf | ||
| sky | -Inf | -Inf | -Inf |
| S/N | 12.5 | 22.5 | 23.8 |
| S/N(c) | 0.0 | 0.0 | 0.0 |
| SN(E/C) |
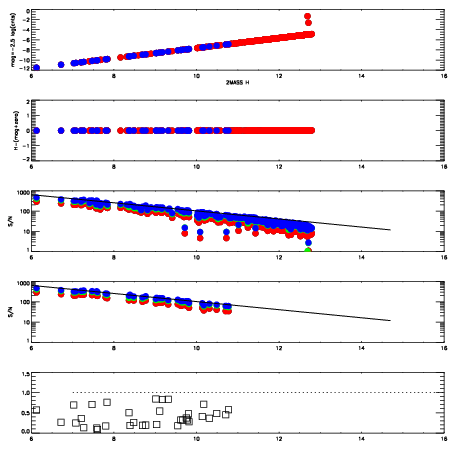
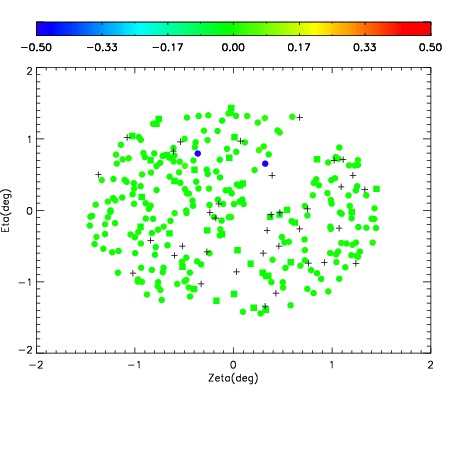
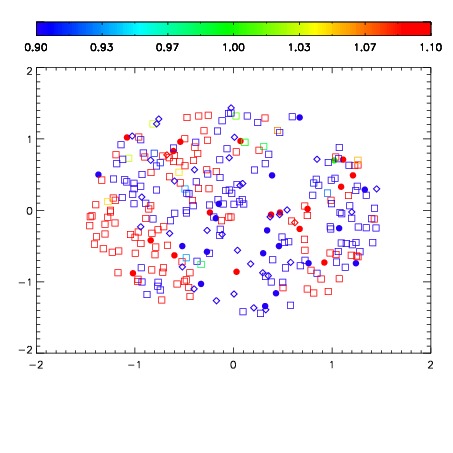
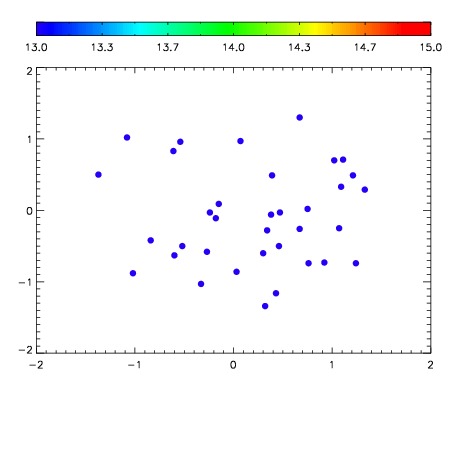

| Frame | Nreads | Zeropoints | Mag plots | Spatial mag deviation | Spatial sky 16325A emission deviations (filled: sky, open: star) | Spatial sky continuum emission | Spatial sky telluric CO2 absorption deviations (filled: H < 10) | |||||||||||||||||||||||
| 0 | 0 |
|
|
|
|
|
|
| IPAIR | NAME | SHIFT | NEWSHIFT | S/N | NAME | SHIFT | NEWSHIFT | S/N |
| 0 | 11170080 | 0.483588 | 0.00000 | 18.4390 | 11170081 | -0.00286770 | 0.486456 | 18.0106 |
| 1 | 11170079 | 0.483125 | 0.000463009 | 18.7817 | 11170078 | 0.00000 | 0.483588 | 18.7873 |
| 2 | 11170083 | 0.481308 | 0.00228000 | 14.0495 | 11170082 | -0.00315481 | 0.486743 | 15.8860 |