| Red | Green | Blue | |
| z | 17.64 | ||
| znorm | Inf | ||
| sky | -Inf | -Inf | -Inf |
| S/N | 29.3 | 48.6 | 51.3 |
| S/N(c) | 0.0 | 0.0 | 0.0 |
| SN(E/C) |
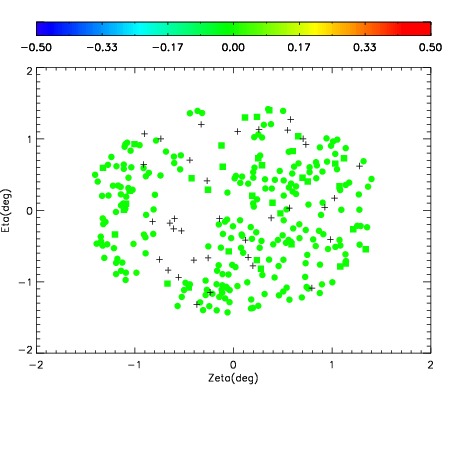
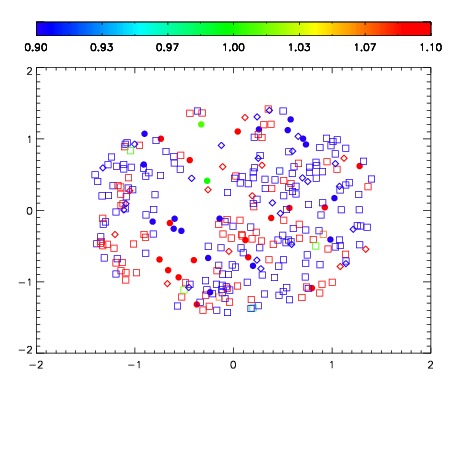
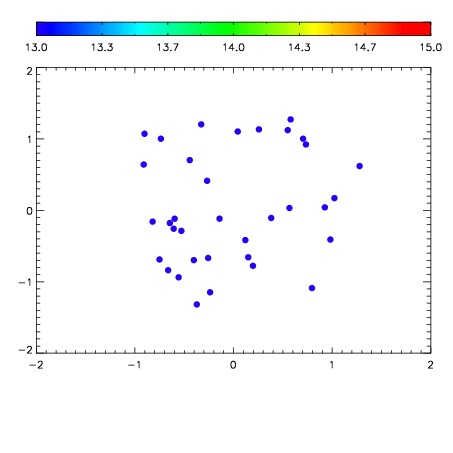

| Frame | Nreads | Zeropoints | Mag plots | Spatial mag deviation | Spatial sky 16325A emission deviations (filled: sky, open: star) | Spatial sky continuum emission | Spatial sky telluric CO2 absorption deviations (filled: H < 10) | |||||||||||||||||||||||
| 0 | 0 |
|
|
|
|
|
|
| IPAIR | NAME | SHIFT | NEWSHIFT | S/N | NAME | SHIFT | NEWSHIFT | S/N |
| 0 | 04560027 | 0.495654 | 0.00000 | 19.1883 | 04560032 | -0.00219919 | 0.497853 | 19.1986 |
| 1 | 04560030 | 0.492545 | 0.00310898 | 19.1958 | 04560029 | -0.00607304 | 0.501727 | 19.2108 |
| 2 | 04560031 | 0.492503 | 0.00315100 | 19.1866 | 04560028 | -0.00504929 | 0.500703 | 19.1958 |
| 3 | 04560026 | 0.495431 | 0.000222981 | 19.1576 | 04560025 | 0.00000 | 0.495654 | 19.1717 |