| Red | Green | Blue | |
| z | 17.64 | ||
| znorm | Inf | ||
| sky | -Inf | -NaN | -Inf |
| S/N | 21.7 | 39.0 | 40.6 |
| S/N(c) | 0.0 | 0.0 | 0.0 |
| SN(E/C) |
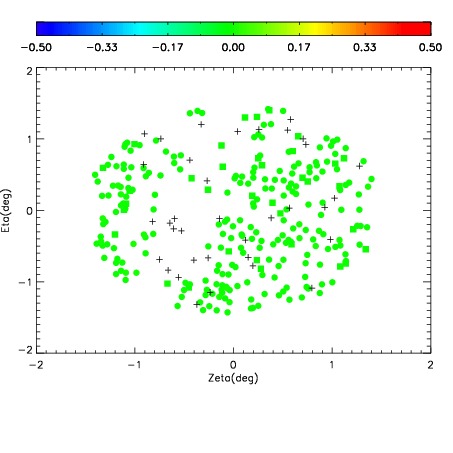
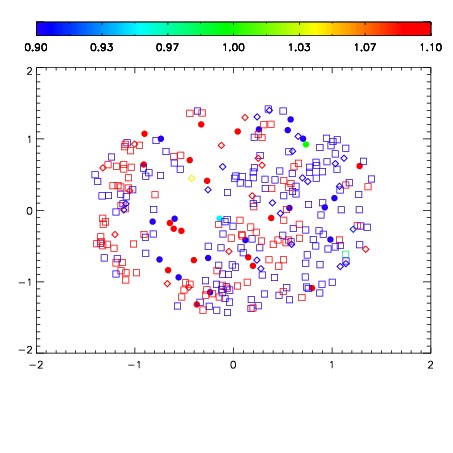
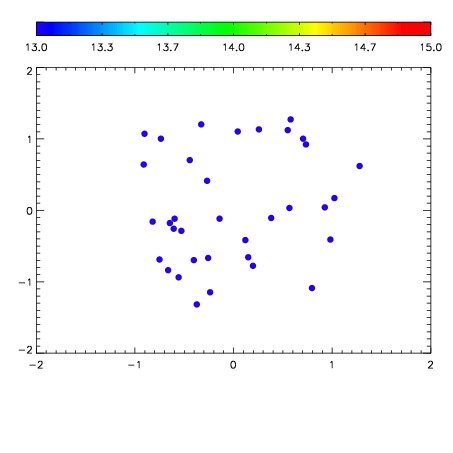

| Frame | Nreads | Zeropoints | Mag plots | Spatial mag deviation | Spatial sky 16325A emission deviations (filled: sky, open: star) | Spatial sky continuum emission | Spatial sky telluric CO2 absorption deviations (filled: H < 10) | |||||||||||||||||||||||
| 0 | 0 |
|
|
|
|
|
|
| IPAIR | NAME | SHIFT | NEWSHIFT | S/N | NAME | SHIFT | NEWSHIFT | S/N |
| 0 | 07850054 | 0.475306 | 0.00000 | 18.7873 | 07850052 | -0.00155180 | 0.476858 | 18.7408 |
| 1 | 07850053 | 0.473263 | 0.00204301 | 18.8084 | 07850051 | 0.00114443 | 0.474162 | 18.8022 |
| 2 | 07850050 | 0.474195 | 0.00111100 | 18.7787 | 07850048 | 0.00000 | 0.475306 | 18.7171 |
| 3 | 07850049 | 0.473598 | 0.00170800 | 18.7075 | 07850055 | 0.000684058 | 0.474622 | 18.7104 |