| Red | Green | Blue | |
| z | 17.64 | ||
| znorm | Inf | ||
| sky | -Inf | -Inf | -Inf |
| S/N | 33.0 | 59.9 | 65.7 |
| S/N(c) | 0.0 | 0.0 | 0.0 |
| SN(E/C) |
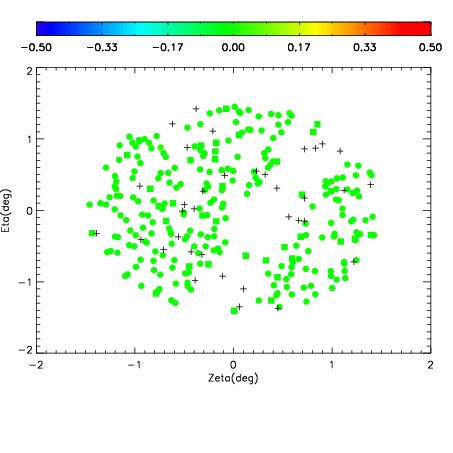
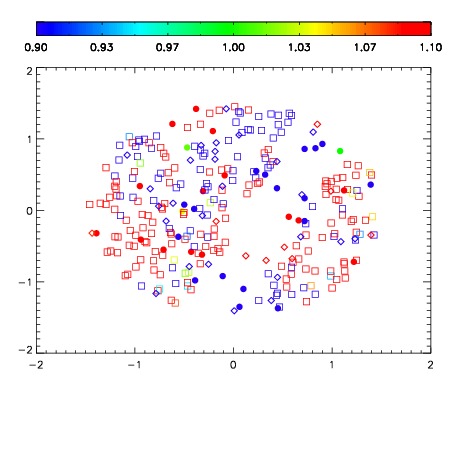
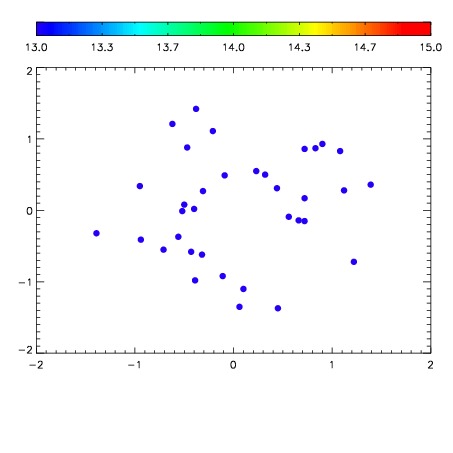

| Frame | Nreads | Zeropoints | Mag plots | Spatial mag deviation | Spatial sky 16325A emission deviations (filled: sky, open: star) | Spatial sky continuum emission | Spatial sky telluric CO2 absorption deviations (filled: H < 10) | |||||||||||||||||||||||
| 0 | 0 |
|
|
|
|
|
|
| IPAIR | NAME | SHIFT | NEWSHIFT | S/N | NAME | SHIFT | NEWSHIFT | S/N |
| 0 | 10920079 | 0.510775 | 0.00000 | 18.8707 | 10920081 | -0.00226380 | 0.513039 | 18.9218 |
| 1 | 10920080 | 0.510680 | 9.50098e-05 | 18.9182 | 10920073 | -0.00216687 | 0.512942 | 18.9277 |
| 2 | 10920076 | 0.510234 | 0.000541031 | 18.8771 | 10920082 | -0.00263955 | 0.513415 | 18.9220 |
| 3 | 10920084 | 0.507758 | 0.00301701 | 18.8696 | 10920085 | -0.00381804 | 0.514593 | 18.9104 |
| 4 | 10920083 | 0.507943 | 0.00283206 | 18.8673 | 10920074 | -0.00241337 | 0.513188 | 18.8514 |
| 5 | 10920071 | 0.510673 | 0.000102043 | 18.8558 | 10920070 | 0.00000 | 0.510775 | 18.8403 |
| 6 | 10920075 | 0.509807 | 0.000968039 | 18.8156 | 10920077 | -0.00270338 | 0.513478 | 18.8282 |
| 7 | 10920072 | 0.510246 | 0.000529051 | 18.7928 | 10920078 | -0.00238579 | 0.513161 | 18.7905 |