| Red | Green | Blue | |
| z | 17.64 | ||
| znorm | Inf | ||
| sky | -Inf | -Inf | -Inf |
| S/N | 21.4 | 39.2 | 41.9 |
| S/N(c) | 0.0 | 0.0 | 0.0 |
| SN(E/C) |
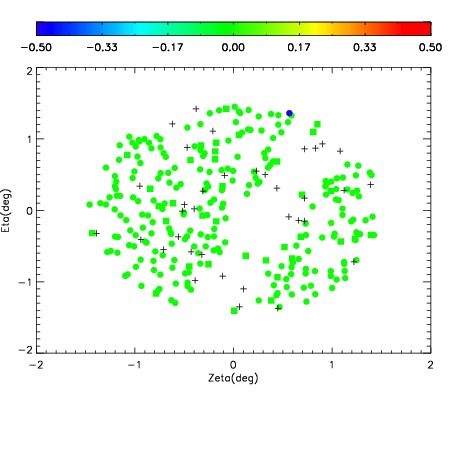
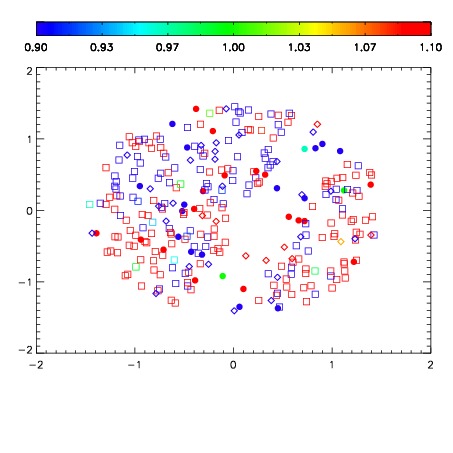
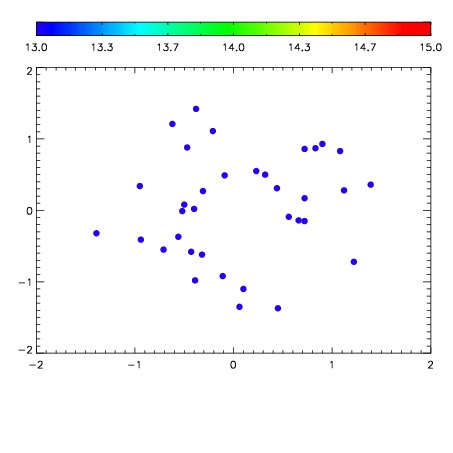

| Frame | Nreads | Zeropoints | Mag plots | Spatial mag deviation | Spatial sky 16325A emission deviations (filled: sky, open: star) | Spatial sky continuum emission | Spatial sky telluric CO2 absorption deviations (filled: H < 10) | |||||||||||||||||||||||
| 0 | 0 |
|
|
|
|
|
|
| IPAIR | NAME | SHIFT | NEWSHIFT | S/N | NAME | SHIFT | NEWSHIFT | S/N |
| 0 | 11100083 | 0.479467 | 0.00000 | 18.7805 | 11100081 | 0.00000 | 0.479467 | 18.5352 |
| 1 | 11100087 | 0.479353 | 0.000113994 | 18.9634 | 11100088 | -0.000405480 | 0.479872 | 18.9452 |
| 2 | 11100086 | 0.479054 | 0.000413001 | 18.7838 | 11100085 | 0.000701333 | 0.478766 | 18.6460 |
| 3 | 11100082 | 0.478744 | 0.000723004 | 18.7276 | 11100084 | 0.00111174 | 0.478355 | 18.1639 |