| Red | Green | Blue | |
| z | 17.64 | ||
| znorm | Inf | ||
| sky | -Inf | -Inf | -NaN |
| S/N | 21.8 | 38.2 | 38.9 |
| S/N(c) | 0.0 | 0.0 | 0.0 |
| SN(E/C) |
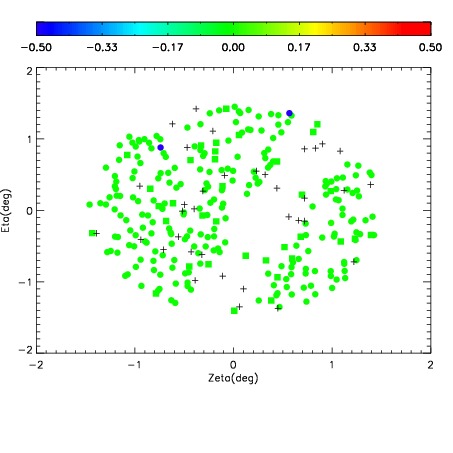
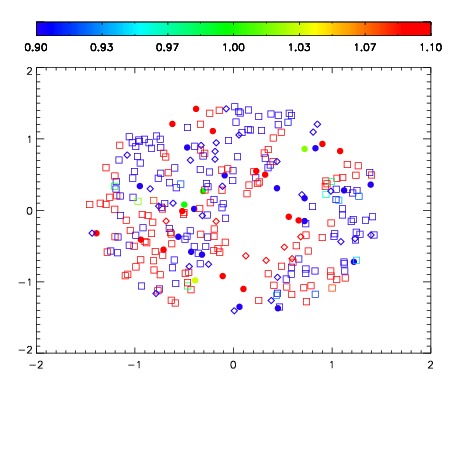
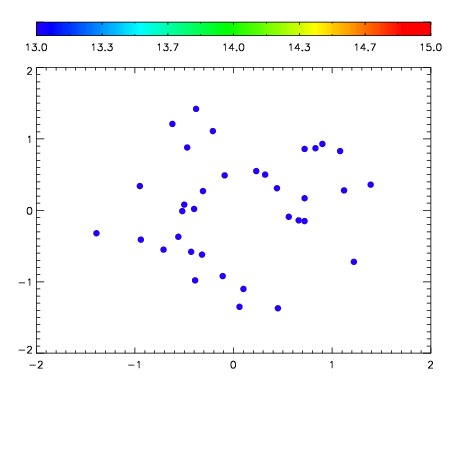

| Frame | Nreads | Zeropoints | Mag plots | Spatial mag deviation | Spatial sky 16325A emission deviations (filled: sky, open: star) | Spatial sky continuum emission | Spatial sky telluric CO2 absorption deviations (filled: H < 10) | |||||||||||||||||||||||
| 0 | 0 |
|
|
|
|
|
|
| IPAIR | NAME | SHIFT | NEWSHIFT | S/N | NAME | SHIFT | NEWSHIFT | S/N |
| 0 | 11180028 | 0.477850 | 0.00000 | 18.6109 | 11180029 | -0.00264248 | 0.480492 | 18.1821 |
| 1 | 11180027 | 0.477086 | 0.000763983 | 19.0052 | 11180026 | -0.00192844 | 0.479778 | 18.9661 |
| 2 | 11180024 | 0.477055 | 0.000794977 | 18.9790 | 11180025 | -0.00207747 | 0.479927 | 18.9440 |
| 3 | 11180023 | 0.476789 | 0.00106099 | 18.9314 | 11180022 | 0.00000 | 0.477850 | 18.4736 |