| Red | Green | Blue | |
| z | 17.64 | ||
| znorm | Inf | ||
| sky | -Inf | -Inf | -Inf |
| S/N | 25.8 | 45.4 | 49.8 |
| S/N(c) | 0.0 | 0.0 | 0.0 |
| SN(E/C) |
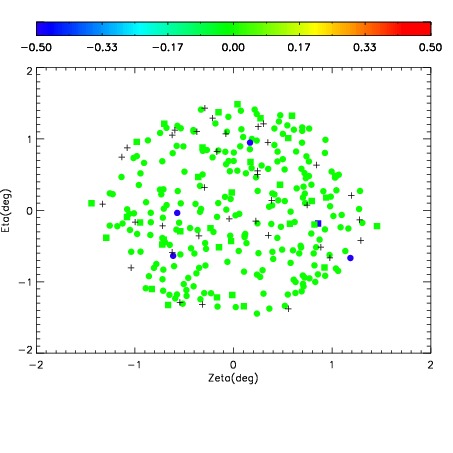
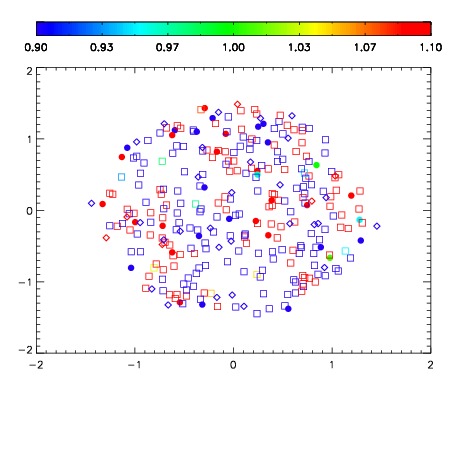
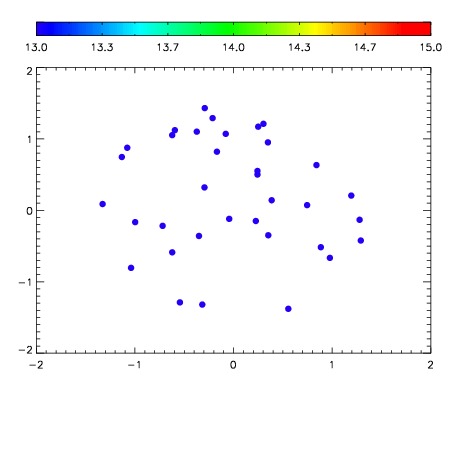

| Frame | Nreads | Zeropoints | Mag plots | Spatial mag deviation | Spatial sky 16325A emission deviations (filled: sky, open: star) | Spatial sky continuum emission | Spatial sky telluric CO2 absorption deviations (filled: H < 10) | |||||||||||||||||||||||
| 0 | 0 |
|
|
|
|
|
|
| IPAIR | NAME | SHIFT | NEWSHIFT | S/N | NAME | SHIFT | NEWSHIFT | S/N |
| 0 | 03770049 | 0.510395 | 0.00000 | 18.9899 | 03770051 | -0.000126126 | 0.510521 | 18.9366 |
| 1 | 03770048 | 0.509121 | 0.00127399 | 19.0647 | 03770050 | 0.00123848 | 0.509157 | 19.0516 |
| 2 | 03770052 | 0.506086 | 0.00430900 | 19.0285 | 03770047 | 0.00000 | 0.510395 | 19.0444 |
| 3 | 03770053 | 0.508133 | 0.00226200 | 18.9319 | 03770054 | 0.00264522 | 0.507750 | 18.8200 |