| Red | Green | Blue | |
| z | 17.63 | ||
| znorm | Inf | ||
| sky | -NaN | -NaN | -NaN |
| S/N | 24.4 | 42.1 | 47.1 |
| S/N(c) | 0.0 | 0.0 | 0.0 |
| SN(E/C) |
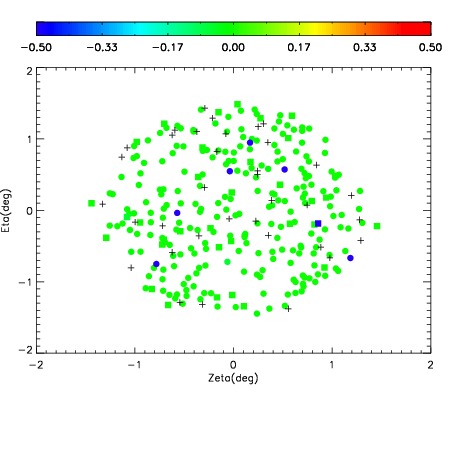
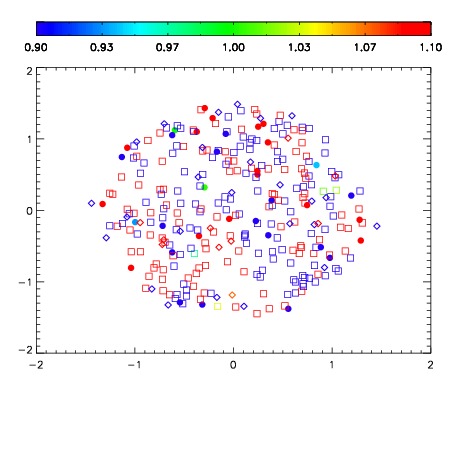
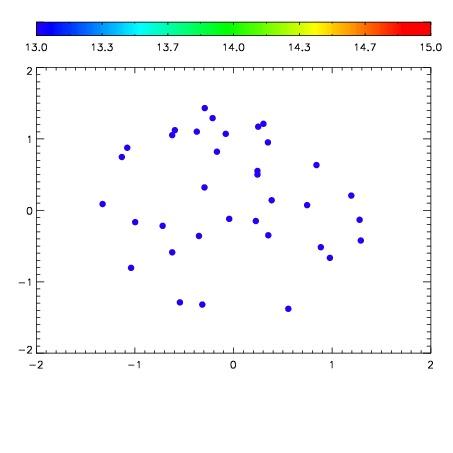

| Frame | Nreads | Zeropoints | Mag plots | Spatial mag deviation | Spatial sky 16325A emission deviations (filled: sky, open: star) | Spatial sky continuum emission | Spatial sky telluric CO2 absorption deviations (filled: H < 10) | |||||||||||||||||||||||
| 0 | 0 |
|
|
|
|
|
|
| IPAIR | NAME | SHIFT | NEWSHIFT | S/N | NAME | SHIFT | NEWSHIFT | S/N |
| 0 | 04290047 | 0.506565 | 0.00000 | 18.9144 | 04290048 | 0.000617384 | 0.505948 | 18.9657 |
| 1 | 04290050 | 0.503474 | 0.00309098 | 18.9967 | 04290052 | 0.00326312 | 0.503302 | 18.9975 |
| 2 | 04290051 | 0.505323 | 0.00124198 | 18.9556 | 04290049 | -0.000932629 | 0.507498 | 18.9821 |
| 3 | 04290046 | 0.505671 | 0.000893950 | 18.8239 | 04290045 | 0.00000 | 0.506565 | 18.8738 |