| Red | Green | Blue | |
| z | 17.64 | ||
| znorm | Inf | ||
| sky | -NaN | -Inf | -Inf |
| S/N | 30.1 | 50.8 | 57.0 |
| S/N(c) | 0.0 | 0.0 | 0.0 |
| SN(E/C) |
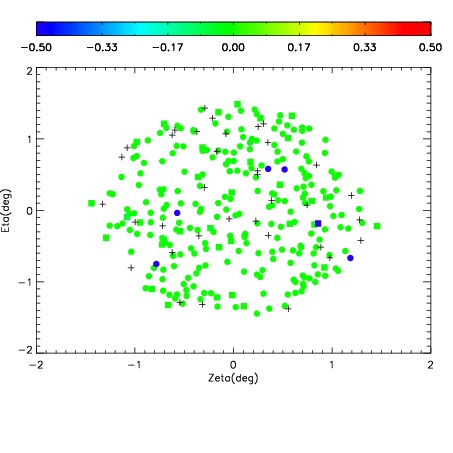
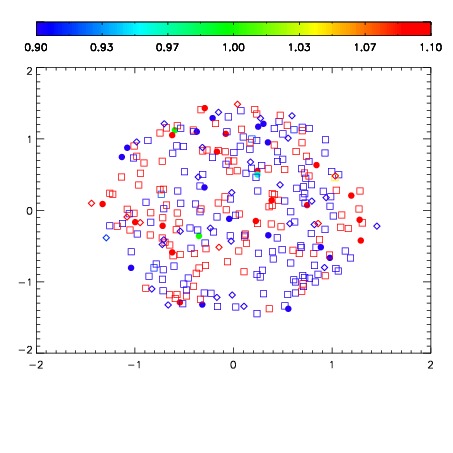


| Frame | Nreads | Zeropoints | Mag plots | Spatial mag deviation | Spatial sky 16325A emission deviations (filled: sky, open: star) | Spatial sky continuum emission | Spatial sky telluric CO2 absorption deviations (filled: H < 10) | |||||||||||||||||||||||
| 0 | 0 |
|
|
|
|
|
|
| IPAIR | NAME | SHIFT | NEWSHIFT | S/N | NAME | SHIFT | NEWSHIFT | S/N |
| 0 | 04370016 | 0.492288 | 0.00000 | 19.2087 | 04370017 | -0.000639032 | 0.492927 | 19.2291 |
| 1 | 04370012 | 0.492043 | 0.000245005 | 19.1973 | 04370013 | 0.00229508 | 0.489993 | 19.2053 |
| 2 | 04370015 | 0.490332 | 0.00195599 | 19.1948 | 04370014 | -0.000191468 | 0.492479 | 19.1882 |
| 3 | 04370011 | 0.491678 | 0.000609994 | 19.1858 | 04370010 | 0.00000 | 0.492288 | 19.1462 |