| Red | Green | Blue | |
| z | 17.64 | ||
| znorm | Inf | ||
| sky | -NaN | -NaN | -Inf |
| S/N | 30.0 | 50.2 | 55.4 |
| S/N(c) | 0.0 | 0.0 | 0.0 |
| SN(E/C) |
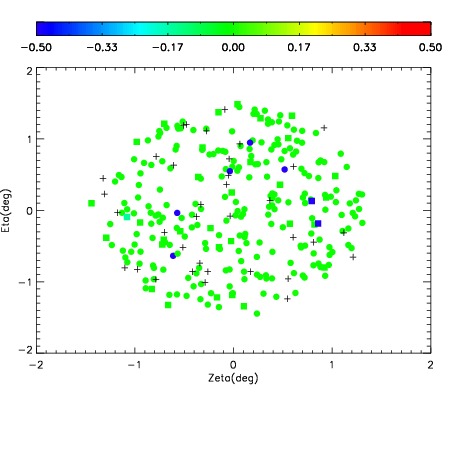
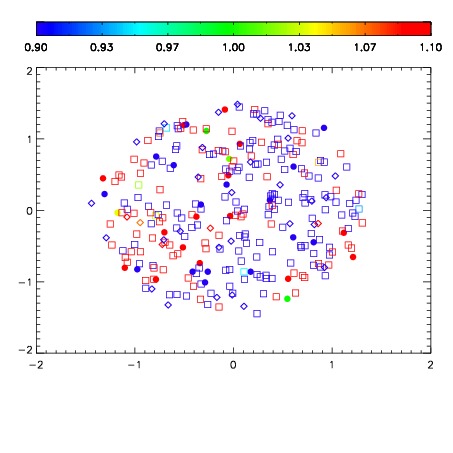
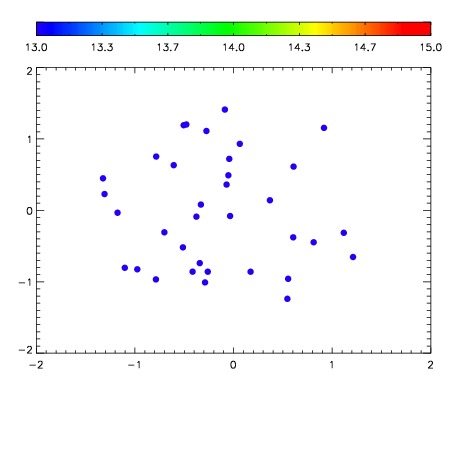

| Frame | Nreads | Zeropoints | Mag plots | Spatial mag deviation | Spatial sky 16325A emission deviations (filled: sky, open: star) | Spatial sky continuum emission | Spatial sky telluric CO2 absorption deviations (filled: H < 10) | |||||||||||||||||||||||
| 0 | 0 |
|
|
|
|
|
|
| IPAIR | NAME | SHIFT | NEWSHIFT | S/N | NAME | SHIFT | NEWSHIFT | S/N |
| 0 | 04560038 | 0.497163 | 0.00000 | 19.2246 | 04560043 | -0.00154368 | 0.498707 | 19.2271 |
| 1 | 04560041 | 0.494203 | 0.00296000 | 19.2429 | 04560039 | -0.00204846 | 0.499211 | 19.2458 |
| 2 | 04560042 | 0.495047 | 0.00211599 | 19.2408 | 04560040 | -0.00200477 | 0.499168 | 19.2417 |
| 3 | 04560037 | 0.496557 | 0.000606000 | 19.2228 | 04560036 | 0.00000 | 0.497163 | 19.1842 |