| Red | Green | Blue | |
| z | 17.64 | ||
| znorm | Inf | ||
| sky | -NaN | -NaN | -Inf |
| S/N | 19.9 | 36.7 | 39.1 |
| S/N(c) | 0.0 | 0.0 | 0.0 |
| SN(E/C) |
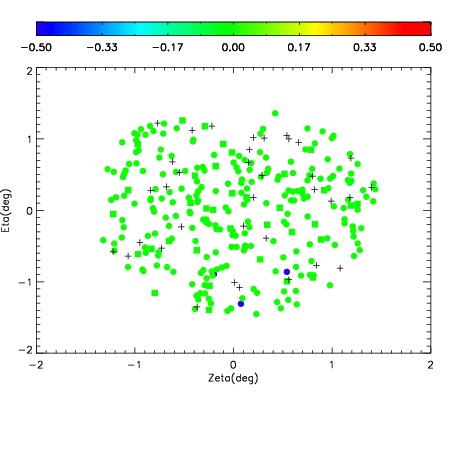
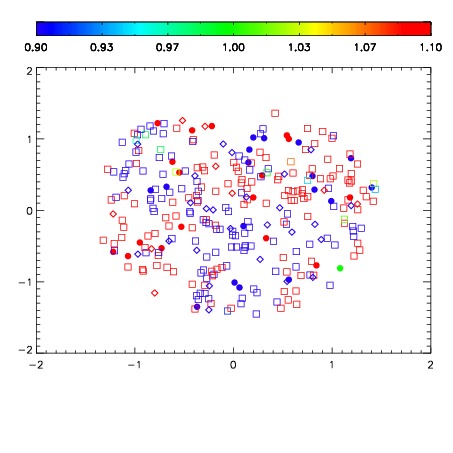
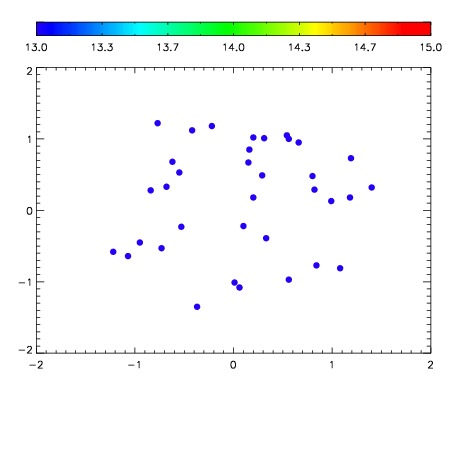

| Frame | Nreads | Zeropoints | Mag plots | Spatial mag deviation | Spatial sky 16325A emission deviations (filled: sky, open: star) | Spatial sky continuum emission | Spatial sky telluric CO2 absorption deviations (filled: H < 10) | |||||||||||||||||||||||
| 0 | 0 |
|
|
|
|
|
|
| IPAIR | NAME | SHIFT | NEWSHIFT | S/N | NAME | SHIFT | NEWSHIFT | S/N |
| 0 | 03740047 | 0.498045 | 0.00000 | 18.6155 | 03740045 | 0.00000 | 0.498045 | 18.6169 |
| 1 | 03740050 | 0.495746 | 0.00229901 | 18.7253 | 03740049 | -0.000346492 | 0.498391 | 18.7438 |
| 2 | 03740046 | 0.494716 | 0.00332901 | 18.6303 | 03740048 | 0.00176047 | 0.496285 | 18.6351 |
| 3 | 03740051 | 0.498045 | 0.00000 | 18.4696 | 03740052 | 0.00255302 | 0.495492 | 18.4183 |