| Red | Green | Blue | |
| z | 17.64 | ||
| znorm | Inf | ||
| sky | -Inf | -Inf | -Inf |
| S/N | 24.5 | 44.6 | 47.8 |
| S/N(c) | 0.0 | 0.0 | 0.0 |
| SN(E/C) |
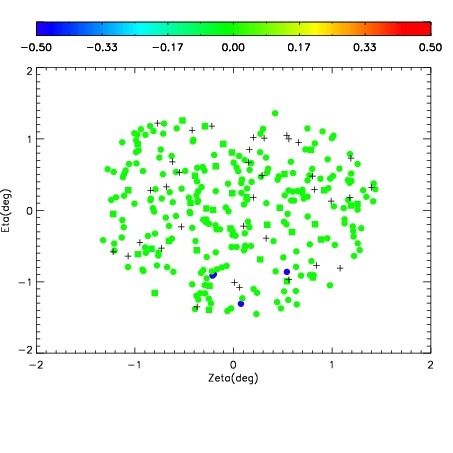
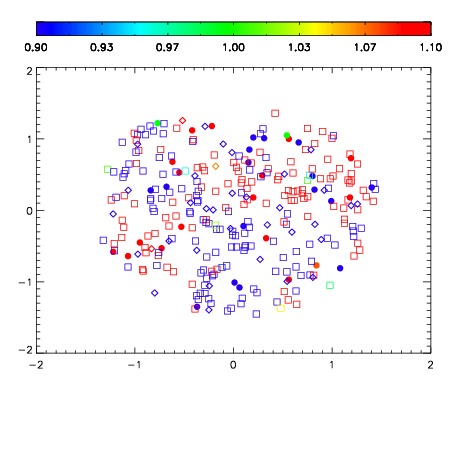
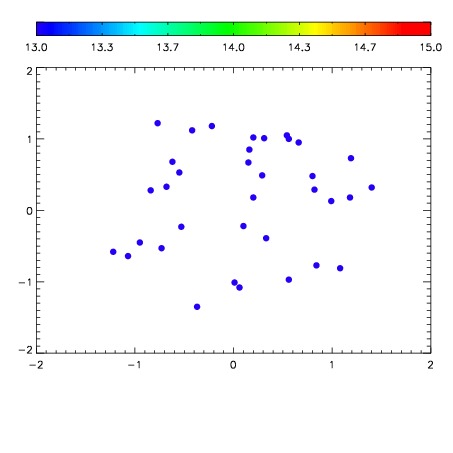

| Frame | Nreads | Zeropoints | Mag plots | Spatial mag deviation | Spatial sky 16325A emission deviations (filled: sky, open: star) | Spatial sky continuum emission | Spatial sky telluric CO2 absorption deviations (filled: H < 10) | |||||||||||||||||||||||
| 0 | 0 |
|
|
|
|
|
|
| IPAIR | NAME | SHIFT | NEWSHIFT | S/N | NAME | SHIFT | NEWSHIFT | S/N |
| 0 | 03750109 | 0.506692 | 0.00000 | 19.0134 | 03750107 | -0.000646209 | 0.507338 | 19.0039 |
| 1 | 03750108 | 0.504720 | 0.00197202 | 18.9756 | 03750103 | 0.00000 | 0.506692 | 18.9726 |
| 2 | 03750104 | 0.501835 | 0.00485700 | 18.9452 | 03750110 | 0.00414315 | 0.502549 | 18.9615 |
| 3 | 03750105 | 0.502988 | 0.00370401 | 18.8883 | 03750106 | 0.00268450 | 0.504008 | 18.9352 |