| Red | Green | Blue | |
| z | 17.64 | ||
| znorm | Inf | ||
| sky | -Inf | -NaN | -Inf |
| S/N | 24.8 | 42.9 | 46.3 |
| S/N(c) | 0.0 | 0.0 | 0.0 |
| SN(E/C) |

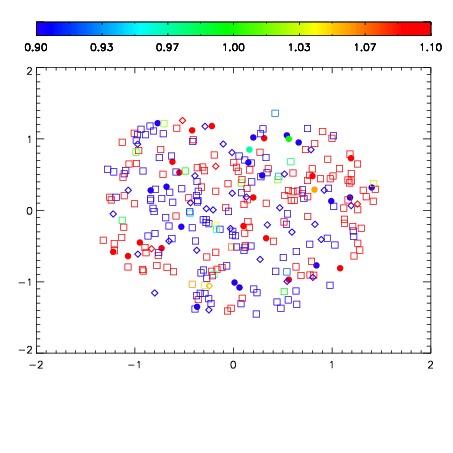
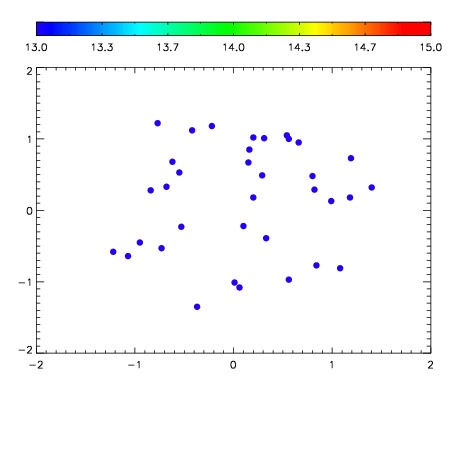

| Frame | Nreads | Zeropoints | Mag plots | Spatial mag deviation | Spatial sky 16325A emission deviations (filled: sky, open: star) | Spatial sky continuum emission | Spatial sky telluric CO2 absorption deviations (filled: H < 10) | |||||||||||||||||||||||
| 0 | 0 |
|
|
|
|
|
|
| IPAIR | NAME | SHIFT | NEWSHIFT | S/N | NAME | SHIFT | NEWSHIFT | S/N |
| 0 | 04290058 | 0.506354 | 0.00000 | 18.9299 | 04290060 | 0.00107875 | 0.505275 | 18.9007 |
| 1 | 04290062 | 0.505406 | 0.000947952 | 19.0422 | 04290063 | 0.00273086 | 0.503623 | 19.0491 |
| 2 | 04290061 | 0.504840 | 0.00151396 | 18.9169 | 04290059 | 0.00144634 | 0.504908 | 18.8724 |
| 3 | 04290057 | 0.504913 | 0.00144100 | 18.9096 | 04290056 | 0.00000 | 0.506354 | 18.8516 |