| Red | Green | Blue | |
| z | 17.64 | ||
| znorm | Inf | ||
| sky | -NaN | -Inf | -Inf |
| S/N | 27.3 | 48.7 | 54.7 |
| S/N(c) | 0.0 | 0.0 | 0.0 |
| SN(E/C) |
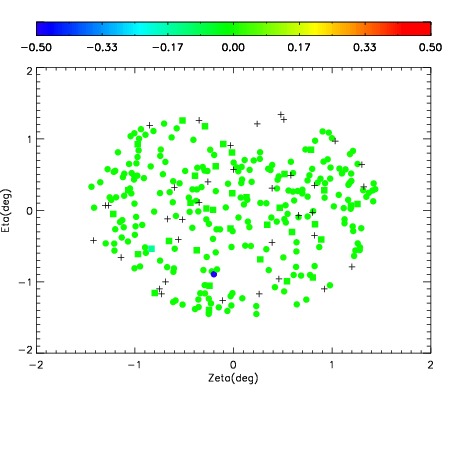
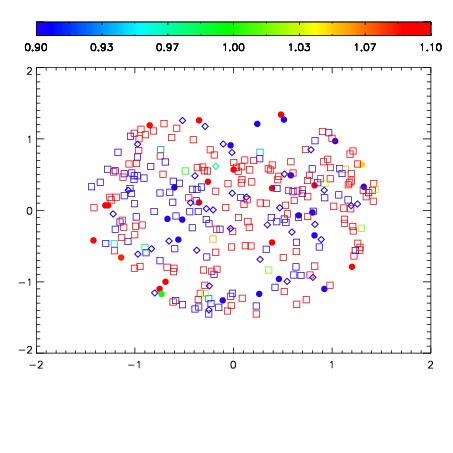
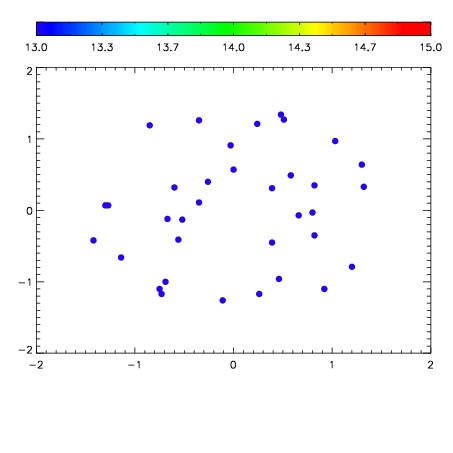

| Frame | Nreads | Zeropoints | Mag plots | Spatial mag deviation | Spatial sky 16325A emission deviations (filled: sky, open: star) | Spatial sky continuum emission | Spatial sky telluric CO2 absorption deviations (filled: H < 10) | |||||||||||||||||||||||
| 0 | 0 |
|
|
|
|
|
|
| IPAIR | NAME | SHIFT | NEWSHIFT | S/N | NAME | SHIFT | NEWSHIFT | S/N |
| 0 | 04560049 | 0.497739 | 0.00000 | 19.1613 | 04560054 | 0.00139804 | 0.496341 | 19.1700 |
| 1 | 04560048 | 0.497012 | 0.000726998 | 19.1617 | 04560051 | 0.00133377 | 0.496405 | 19.1891 |
| 2 | 04560053 | 0.497727 | 1.19805e-05 | 19.1390 | 04560050 | 0.00110562 | 0.496633 | 19.1653 |
| 3 | 04560052 | 0.497530 | 0.000208974 | 19.1384 | 04560047 | 0.00000 | 0.497739 | 19.1435 |