| Red | Green | Blue | |
| z | 17.64 | ||
| znorm | Inf | ||
| sky | -Inf | -NaN | -Inf |
| S/N | 25.5 | 46.5 | 50.6 |
| S/N(c) | 0.0 | 0.0 | 0.0 |
| SN(E/C) |
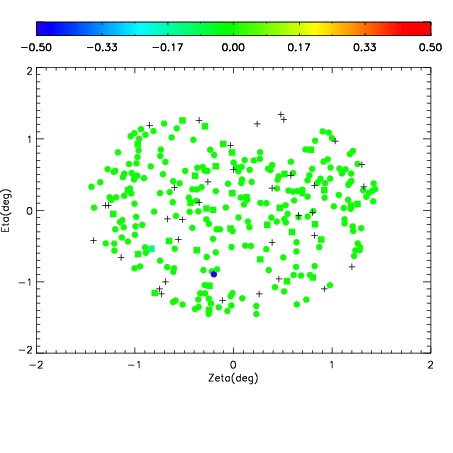
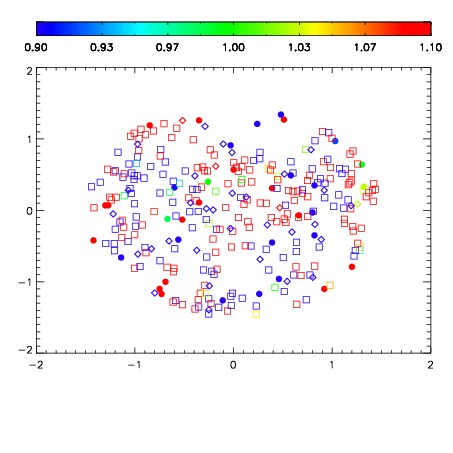
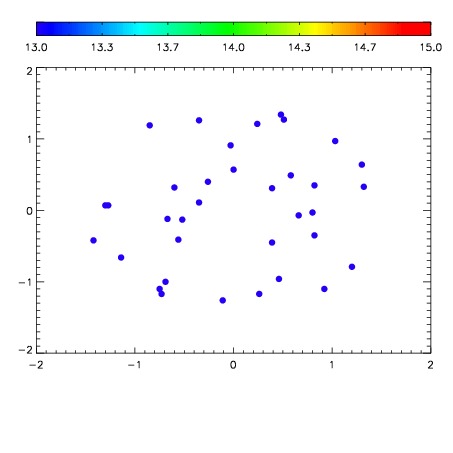

| Frame | Nreads | Zeropoints | Mag plots | Spatial mag deviation | Spatial sky 16325A emission deviations (filled: sky, open: star) | Spatial sky continuum emission | Spatial sky telluric CO2 absorption deviations (filled: H < 10) | |||||||||||||||||||||||
| 0 | 0 |
|
|
|
|
|
|
| IPAIR | NAME | SHIFT | NEWSHIFT | S/N | NAME | SHIFT | NEWSHIFT | S/N |
| 0 | 04860034 | 0.495141 | 0.00000 | 19.1614 | 04860031 | 0.00443917 | 0.490702 | 19.1485 |
| 1 | 04860030 | 0.492174 | 0.00296700 | 19.1442 | 04860035 | 0.000727034 | 0.494414 | 19.1437 |
| 2 | 04860029 | 0.492673 | 0.00246799 | 19.1186 | 04860032 | 0.00128587 | 0.493855 | 19.1381 |
| 3 | 04860033 | 0.493734 | 0.00140700 | 19.1118 | 04860028 | 0.00000 | 0.495141 | 19.0817 |