| Red | Green | Blue | |
| z | 17.64 | ||
| znorm | Inf | ||
| sky | -NaN | -Inf | -NaN |
| S/N | 10.0 | 21.6 | 19.6 |
| S/N(c) | 0.0 | 0.0 | 0.0 |
| SN(E/C) |
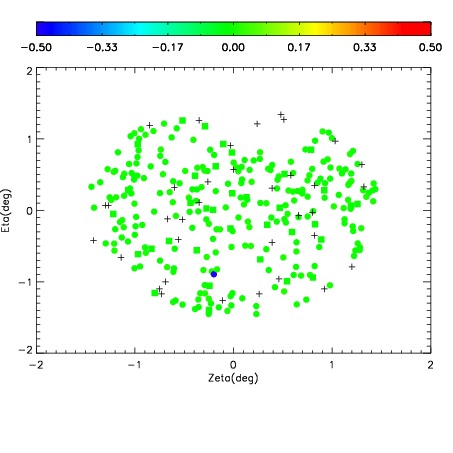
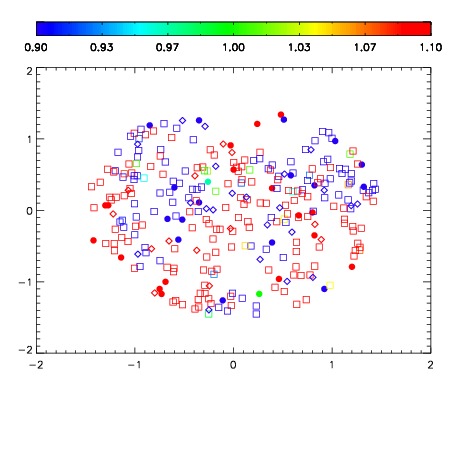
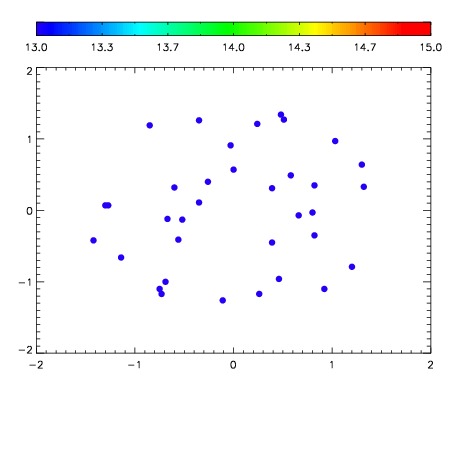

| Frame | Nreads | Zeropoints | Mag plots | Spatial mag deviation | Spatial sky 16325A emission deviations (filled: sky, open: star) | Spatial sky continuum emission | Spatial sky telluric CO2 absorption deviations (filled: H < 10) | |||||||||||||||||||||||
| 0 | 0 |
|
|
|
|
|
|
| IPAIR | NAME | SHIFT | NEWSHIFT | S/N | NAME | SHIFT | NEWSHIFT | S/N |
| 0 | 08130022 | 0.513290 | 0.00000 | 17.9272 | 08130023 | 0.00146288 | 0.511827 | 17.7916 |
| 1 | 08130021 | 0.508232 | 0.00505799 | 18.0261 | 08130020 | -0.000890820 | 0.514181 | 17.9938 |
| 2 | 08130017 | 0.510629 | 0.00266099 | 17.7567 | 08130019 | -0.00173642 | 0.515026 | 17.7043 |
| 3 | 08130018 | 0.512351 | 0.000939012 | 17.5505 | 08130016 | 0.00000 | 0.513290 | 17.2529 |