| Red | Green | Blue | |
| z | 17.64 | ||
| znorm | Inf | ||
| sky | -Inf | -Inf | -NaN |
| S/N | 27.8 | 48.2 | 54.3 |
| S/N(c) | 0.0 | 0.0 | 0.0 |
| SN(E/C) |
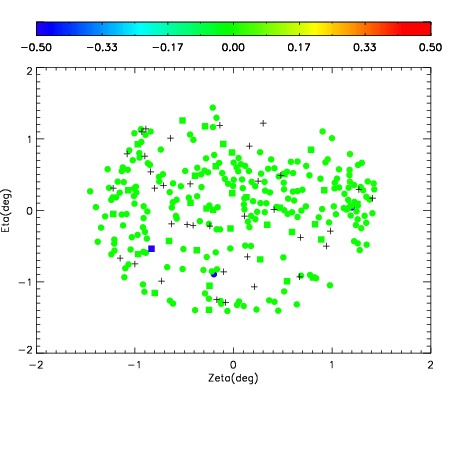
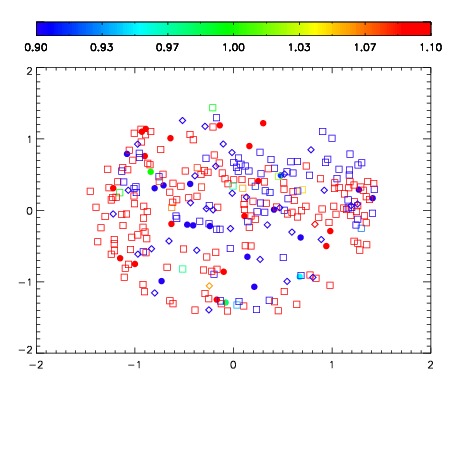


| Frame | Nreads | Zeropoints | Mag plots | Spatial mag deviation | Spatial sky 16325A emission deviations (filled: sky, open: star) | Spatial sky continuum emission | Spatial sky telluric CO2 absorption deviations (filled: H < 10) | |||||||||||||||||||||||
| 0 | 0 |
|
|
|
|
|
|
| IPAIR | NAME | SHIFT | NEWSHIFT | S/N | NAME | SHIFT | NEWSHIFT | S/N |
| 0 | 04650027 | 0.490253 | 0.00000 | 19.1198 | 04650028 | 0.00202439 | 0.488229 | 19.0599 |
| 1 | 04650026 | 0.489012 | 0.00124100 | 19.0599 | 04650029 | 0.00261771 | 0.487635 | 19.0524 |
| 2 | 04650031 | 0.489939 | 0.000313997 | 19.0419 | 04650025 | 0.00000 | 0.490253 | 19.0357 |
| 3 | 04650030 | 0.488592 | 0.00166100 | 18.9616 | 04650032 | 0.00384757 | 0.486405 | 19.0306 |