| Red | Green | Blue | |
| z | 17.64 | ||
| znorm | Inf | ||
| sky | -Inf | -Inf | -Inf |
| S/N | 15.0 | 27.2 | 27.7 |
| S/N(c) | 0.0 | 0.0 | 0.0 |
| SN(E/C) |
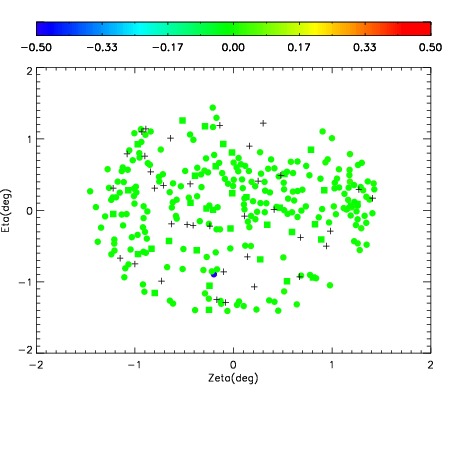
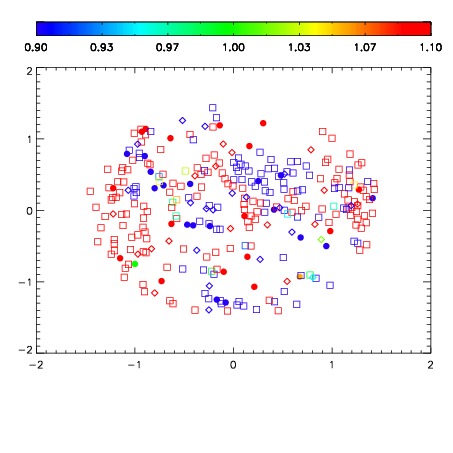
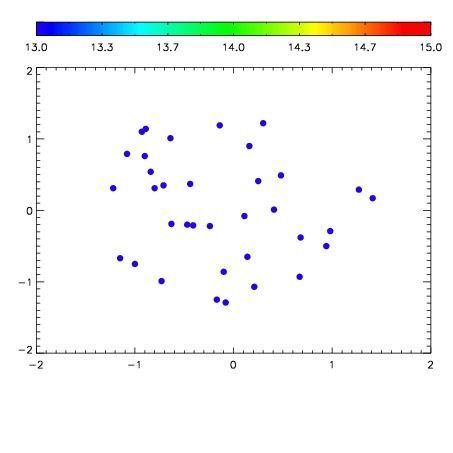

| Frame | Nreads | Zeropoints | Mag plots | Spatial mag deviation | Spatial sky 16325A emission deviations (filled: sky, open: star) | Spatial sky continuum emission | Spatial sky telluric CO2 absorption deviations (filled: H < 10) | |||||||||||||||||||||||
| 0 | 0 |
|
|
|
|
|
|
| IPAIR | NAME | SHIFT | NEWSHIFT | S/N | NAME | SHIFT | NEWSHIFT | S/N |
| 0 | 05170017 | 0.500827 | 0.00000 | 18.2047 | 05170015 | 0.000737978 | 0.500089 | 18.3409 |
| 1 | 05170013 | 0.498910 | 0.00191700 | 18.1451 | 05170014 | 0.00109415 | 0.499733 | 18.3379 |
| 2 | 05170012 | 0.498486 | 0.00234100 | 18.1398 | 05170011 | 0.00000 | 0.500827 | 18.1698 |
| 3 | 05170016 | 0.498917 | 0.00191000 | 18.1004 | 05170018 | 0.00426525 | 0.496562 | 18.1000 |