| Red | Green | Blue | |
| z | 17.64 | ||
| znorm | Inf | ||
| sky | -Inf | -Inf | -Inf |
| S/N | 22.6 | 40.8 | 44.2 |
| S/N(c) | 0.0 | 0.0 | 0.0 |
| SN(E/C) |


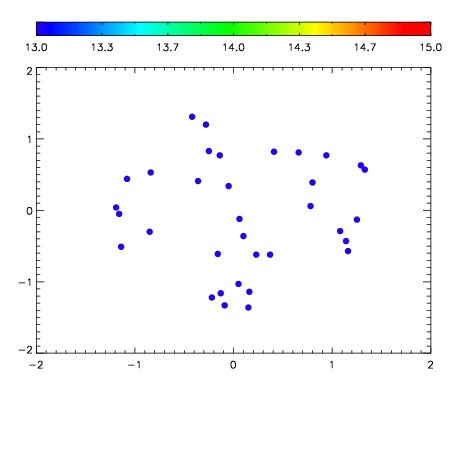

| Frame | Nreads | Zeropoints | Mag plots | Spatial mag deviation | Spatial sky 16325A emission deviations (filled: sky, open: star) | Spatial sky continuum emission | Spatial sky telluric CO2 absorption deviations (filled: H < 10) | |||||||||||||||||||||||
| 0 | 0 |
|
|
|
|
|
|
| IPAIR | NAME | SHIFT | NEWSHIFT | S/N | NAME | SHIFT | NEWSHIFT | S/N |
| 0 | 05220016 | 0.501662 | 0.00000 | 18.8675 | 05220013 | 0.00285405 | 0.498808 | 18.7284 |
| 1 | 05220015 | 0.501068 | 0.000594020 | 18.9556 | 05220014 | 0.00128878 | 0.500373 | 18.9062 |
| 2 | 05220012 | 0.499807 | 0.00185502 | 18.9054 | 05220017 | 0.00311063 | 0.498551 | 18.8289 |
| 3 | 05220011 | 0.499270 | 0.00239202 | 18.8420 | 05220010 | 0.00000 | 0.501662 | 18.4734 |