| Red | Green | Blue | |
| z | 17.64 | ||
| znorm | Inf | ||
| sky | -Inf | -Inf | -Inf |
| S/N | 16.8 | 31.5 | 33.6 |
| S/N(c) | 0.0 | 0.0 | 0.0 |
| SN(E/C) |
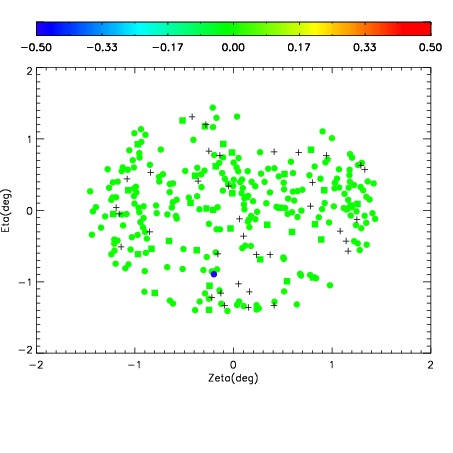
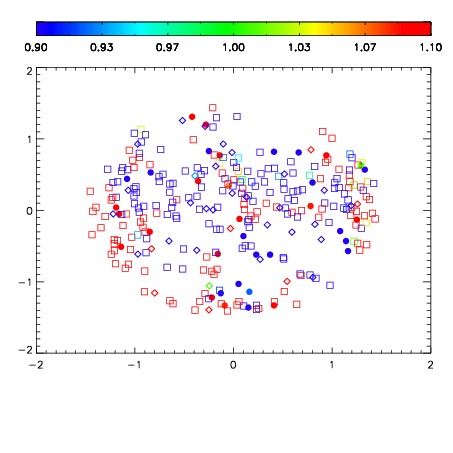
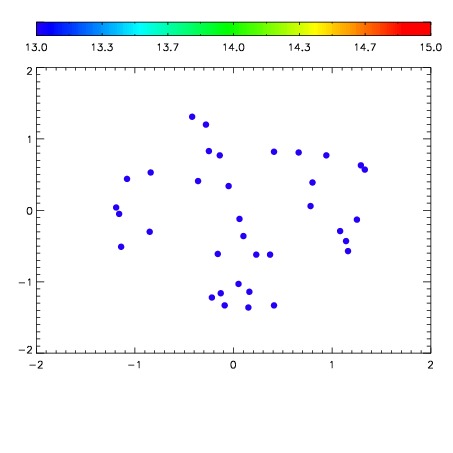

| Frame | Nreads | Zeropoints | Mag plots | Spatial mag deviation | Spatial sky 16325A emission deviations (filled: sky, open: star) | Spatial sky continuum emission | Spatial sky telluric CO2 absorption deviations (filled: H < 10) | |||||||||||||||||||||||
| 0 | 0 |
|
|
|
|
|
|
| IPAIR | NAME | SHIFT | NEWSHIFT | S/N | NAME | SHIFT | NEWSHIFT | S/N |
| 0 | 05480016 | 0.489986 | 0.00000 | 18.2508 | 05480017 | 0.00463426 | 0.485352 | 18.3602 |
| 1 | 05480011 | 0.486009 | 0.00397700 | 18.7870 | 05480010 | 0.00000 | 0.489986 | 18.7453 |
| 2 | 05480012 | 0.486746 | 0.00323999 | 18.7271 | 05480013 | 0.000973061 | 0.489013 | 18.5957 |
| 3 | 05480015 | 0.488354 | 0.00163200 | 17.9885 | 05480014 | 0.000531065 | 0.489455 | 18.0479 |