| Red | Green | Blue | |
| z | 17.64 | ||
| znorm | Inf | ||
| sky | -NaN | -NaN | -Inf |
| S/N | 25.7 | 46.3 | 51.5 |
| S/N(c) | 0.0 | 0.0 | 0.0 |
| SN(E/C) |
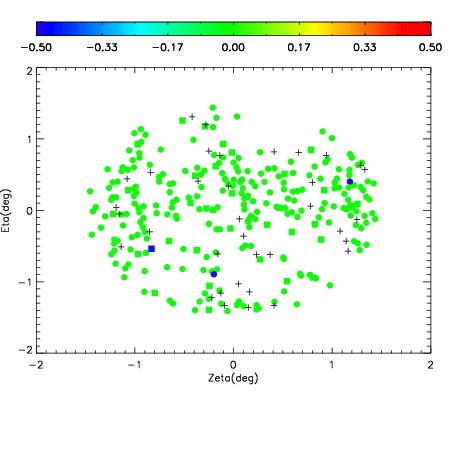
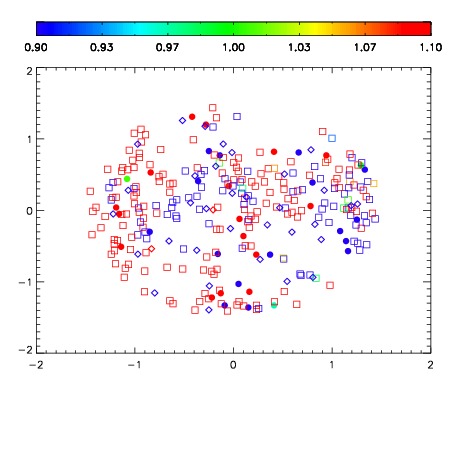
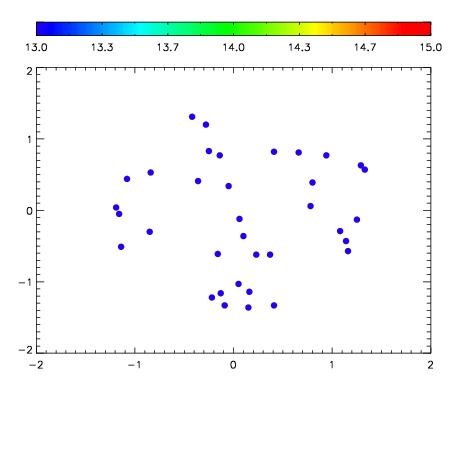

| Frame | Nreads | Zeropoints | Mag plots | Spatial mag deviation | Spatial sky 16325A emission deviations (filled: sky, open: star) | Spatial sky continuum emission | Spatial sky telluric CO2 absorption deviations (filled: H < 10) | |||||||||||||||||||||||
| 0 | 0 |
|
|
|
|
|
|
| IPAIR | NAME | SHIFT | NEWSHIFT | S/N | NAME | SHIFT | NEWSHIFT | S/N |
| 0 | 08190038 | 0.509809 | 0.00000 | 18.9346 | 08190040 | -0.000688741 | 0.510498 | 18.9183 |
| 1 | 08190037 | 0.507195 | 0.00261402 | 19.0312 | 08190036 | 0.00000 | 0.509809 | 19.0455 |
| 2 | 08190041 | 0.501518 | 0.00829101 | 18.9941 | 08190043 | -4.90001e-05 | 0.509858 | 18.9926 |
| 3 | 08190042 | 0.507842 | 0.00196701 | 18.9915 | 08190039 | -0.000158416 | 0.509967 | 18.9895 |