| Red | Green | Blue | |
| z | 17.64 | ||
| znorm | Inf | ||
| sky | -Inf | -Inf | -Inf |
| S/N | 18.1 | 33.0 | 35.1 |
| S/N(c) | 0.0 | 0.0 | 0.0 |
| SN(E/C) |
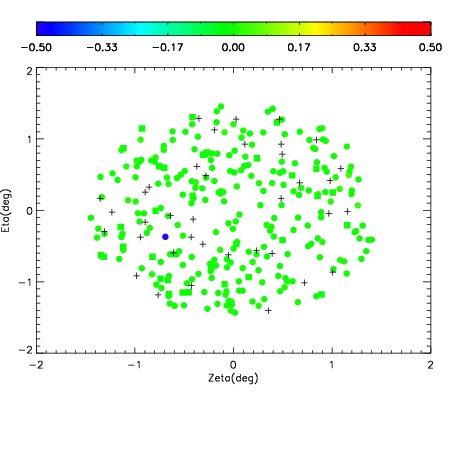
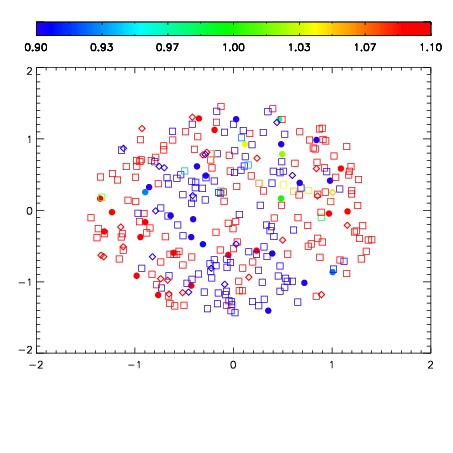
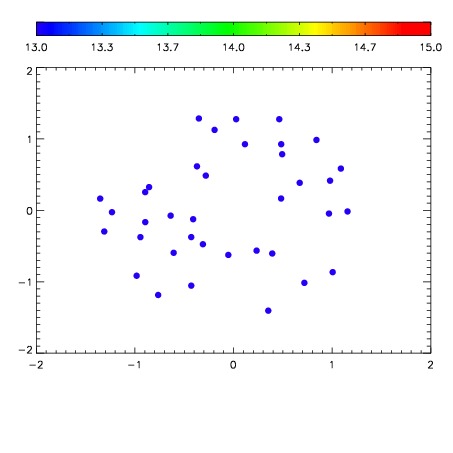

| Frame | Nreads | Zeropoints | Mag plots | Spatial mag deviation | Spatial sky 16325A emission deviations (filled: sky, open: star) | Spatial sky continuum emission | Spatial sky telluric CO2 absorption deviations (filled: H < 10) | |||||||||||||||||||||||
| 0 | 0 |
|
|
|
|
|
|
| IPAIR | NAME | SHIFT | NEWSHIFT | S/N | NAME | SHIFT | NEWSHIFT | S/N |
| 0 | 03720088 | 0.512793 | 0.00000 | 18.6008 | 03720093 | -0.00159352 | 0.514387 | 18.6223 |
| 1 | 03720091 | 0.510558 | 0.00223500 | 18.7507 | 03720090 | -0.00231943 | 0.515112 | 18.7219 |
| 2 | 03720092 | 0.511351 | 0.00144202 | 18.6487 | 03720089 | -0.000685149 | 0.513478 | 18.6978 |
| 3 | 03720087 | 0.506889 | 0.00590402 | 18.5236 | 03720086 | 0.00000 | 0.512793 | 18.4358 |