| Red | Green | Blue | |
| z | 17.64 | ||
| znorm | Inf | ||
| sky | -NaN | -NaN | -Inf |
| S/N | 19.6 | 35.9 | 38.0 |
| S/N(c) | 0.0 | 0.0 | 0.0 |
| SN(E/C) |
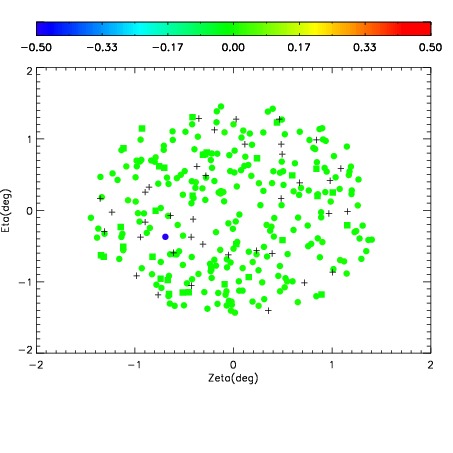
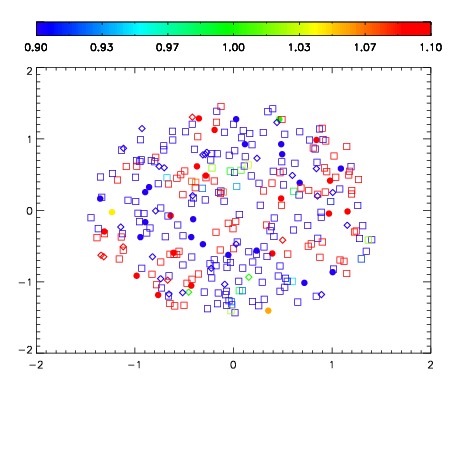
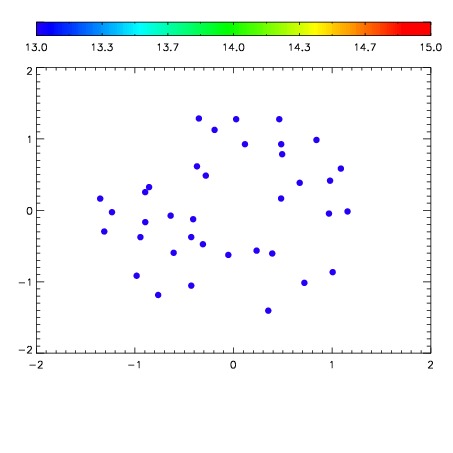

| Frame | Nreads | Zeropoints | Mag plots | Spatial mag deviation | Spatial sky 16325A emission deviations (filled: sky, open: star) | Spatial sky continuum emission | Spatial sky telluric CO2 absorption deviations (filled: H < 10) | |||||||||||||||||||||||
| 0 | 0 |
|
|
|
|
|
|
| IPAIR | NAME | SHIFT | NEWSHIFT | S/N | NAME | SHIFT | NEWSHIFT | S/N |
| 0 | 04570031 | 0.504677 | 0.00000 | 18.3020 | 04570029 | -0.00255227 | 0.507229 | 18.5762 |
| 1 | 04570027 | 0.500907 | 0.00376999 | 18.7539 | 04570028 | -0.00167976 | 0.506357 | 18.7112 |
| 2 | 04570026 | 0.500964 | 0.00371301 | 18.6233 | 04570025 | 0.00000 | 0.504677 | 18.6902 |
| 3 | 04570030 | 0.499845 | 0.00483200 | 18.3002 | 04570032 | -2.84180e-05 | 0.504705 | 18.3433 |