| Red | Green | Blue | |
| z | 17.64 | ||
| znorm | Inf | ||
| sky | -Inf | -Inf | -Inf |
| S/N | 25.6 | 44.2 | 46.2 |
| S/N(c) | 0.0 | 0.0 | 0.0 |
| SN(E/C) |
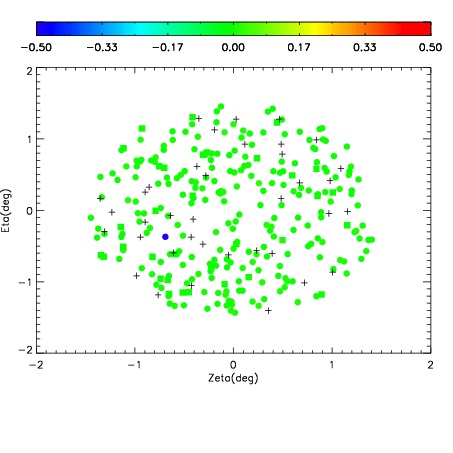
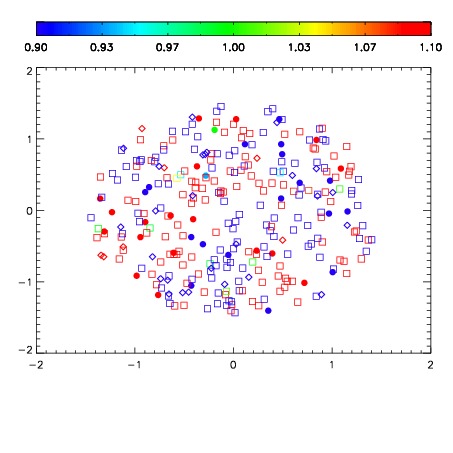
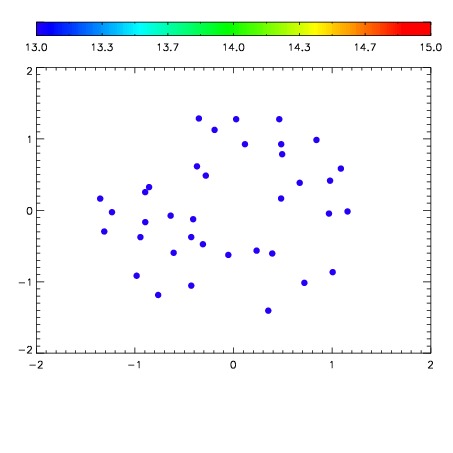

| Frame | Nreads | Zeropoints | Mag plots | Spatial mag deviation | Spatial sky 16325A emission deviations (filled: sky, open: star) | Spatial sky continuum emission | Spatial sky telluric CO2 absorption deviations (filled: H < 10) | |||||||||||||||||||||||
| 0 | 0 |
|
|
|
|
|
|
| IPAIR | NAME | SHIFT | NEWSHIFT | S/N | NAME | SHIFT | NEWSHIFT | S/N |
| 0 | 05180017 | 0.495384 | 0.00000 | 19.0624 | 05180014 | 0.000527852 | 0.494856 | 19.0660 |
| 1 | 05180016 | 0.495259 | 0.000125021 | 19.0377 | 05180015 | -0.000276999 | 0.495661 | 19.0459 |
| 2 | 05180012 | 0.494279 | 0.00110501 | 19.0136 | 05180011 | 0.00000 | 0.495384 | 19.0094 |
| 3 | 05180013 | 0.495187 | 0.000196993 | 19.0042 | 05180018 | -0.00153342 | 0.496917 | 18.9849 |