| Red | Green | Blue | |
| z | 17.64 | ||
| znorm | Inf | ||
| sky | -Inf | -Inf | -Inf |
| S/N | 24.5 | 42.7 | 44.8 |
| S/N(c) | 0.0 | 0.0 | 0.0 |
| SN(E/C) |
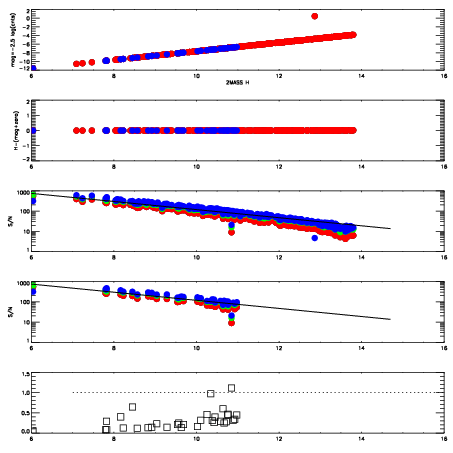
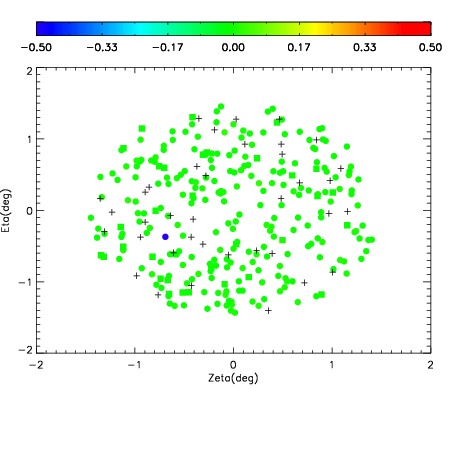
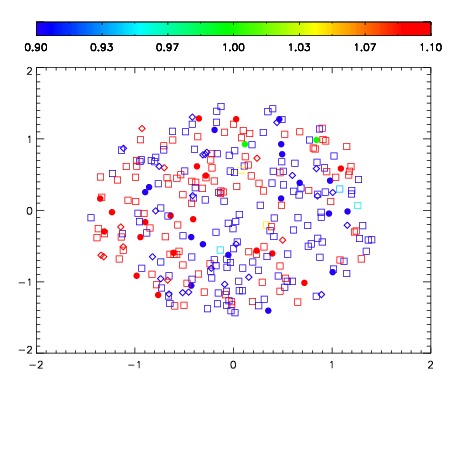
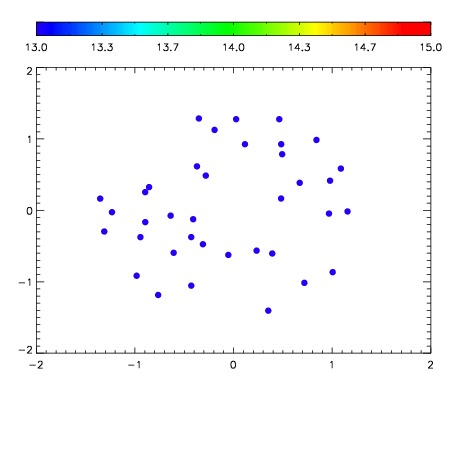

| Frame | Nreads | Zeropoints | Mag plots | Spatial mag deviation | Spatial sky 16325A emission deviations (filled: sky, open: star) | Spatial sky continuum emission | Spatial sky telluric CO2 absorption deviations (filled: H < 10) | |||||||||||||||||||||||
| 0 | 0 |
|
|
|
|
|
|
| IPAIR | NAME | SHIFT | NEWSHIFT | S/N | NAME | SHIFT | NEWSHIFT | S/N |
| 0 | 05190016 | 0.497861 | 0.00000 | 19.0270 | 05190018 | -6.66918e-05 | 0.497928 | 19.0378 |
| 1 | 05190012 | 0.495639 | 0.00222200 | 19.0171 | 05190011 | 0.00000 | 0.497861 | 18.9902 |
| 2 | 05190017 | 0.497746 | 0.000115007 | 19.0030 | 05190014 | -0.000462789 | 0.498324 | 18.9767 |
| 3 | 05190013 | 0.496848 | 0.00101301 | 18.6674 | 05190015 | -0.00181881 | 0.499680 | 18.9345 |