| Red | Green | Blue | |
| z | 17.64 | ||
| znorm | Inf | ||
| sky | -Inf | -Inf | -Inf |
| S/N | 26.1 | 41.7 | 47.3 |
| S/N(c) | 0.0 | 0.0 | 0.0 |
| SN(E/C) |

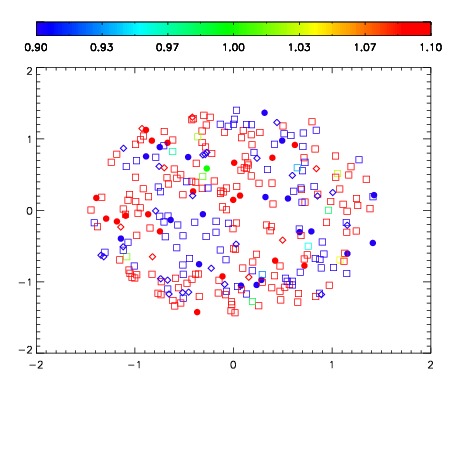


| Frame | Nreads | Zeropoints | Mag plots | Spatial mag deviation | Spatial sky 16325A emission deviations (filled: sky, open: star) | Spatial sky continuum emission | Spatial sky telluric CO2 absorption deviations (filled: H < 10) | |||||||||||||||||||||||
| 0 | 0 |
|
|
|
|
|
|
| IPAIR | NAME | SHIFT | NEWSHIFT | S/N | NAME | SHIFT | NEWSHIFT | S/N |
| 0 | 05200012 | 0.494968 | 0.00000 | 19.0820 | 05200013 | 0.00169556 | 0.493272 | 19.0719 |
| 1 | 05200016 | 0.492777 | 0.00219101 | 19.0766 | 05200014 | 0.00142867 | 0.493539 | 19.0712 |
| 2 | 05200015 | 0.492061 | 0.00290701 | 19.0614 | 05200017 | 0.00103271 | 0.493935 | 19.0585 |
| 3 | 05200011 | 0.492915 | 0.00205299 | 18.9754 | 05200010 | 0.00000 | 0.494968 | 18.9481 |