| Red | Green | Blue | |
| z | 17.64 | ||
| znorm | Inf | ||
| sky | -Inf | -Inf | -Inf |
| S/N | 9.9 | 18.5 | 21.6 |
| S/N(c) | 0.0 | 0.0 | 0.0 |
| SN(E/C) |
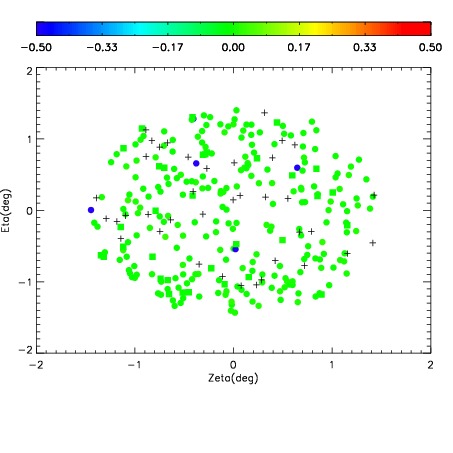
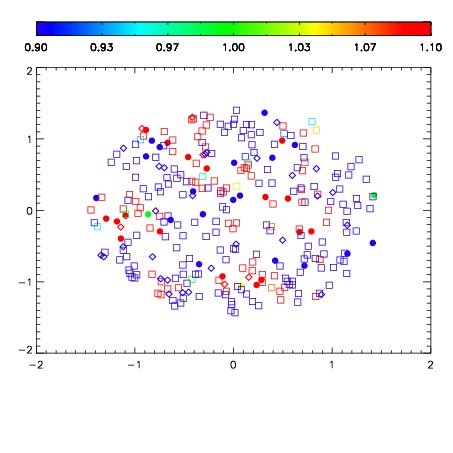
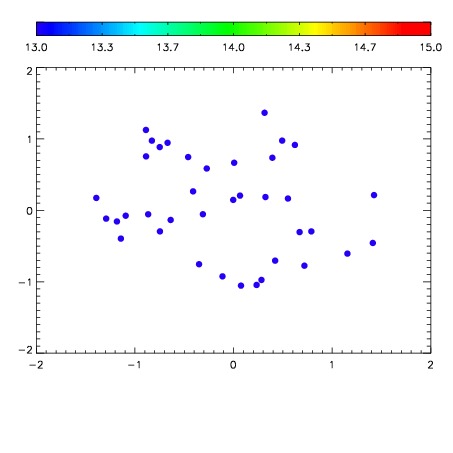

| Frame | Nreads | Zeropoints | Mag plots | Spatial mag deviation | Spatial sky 16325A emission deviations (filled: sky, open: star) | Spatial sky continuum emission | Spatial sky telluric CO2 absorption deviations (filled: H < 10) | |||||||||||||||||||||||
| 0 | 0 |
|
|
|
|
|
|
| IPAIR | NAME | SHIFT | NEWSHIFT | S/N | NAME | SHIFT | NEWSHIFT | S/N |
| 0 | 07630049 | 0.478074 | 0.00000 | 17.3998 | 07630050 | -0.00638159 | 0.484456 | 17.1192 |
| 1 | 07630045 | 0.477733 | 0.000341028 | 18.2519 | 07630043 | 0.00000 | 0.478074 | 17.9931 |
| 2 | 07630044 | 0.477646 | 0.000428021 | 18.1604 | 07630046 | 0.00358855 | 0.474485 | 17.8511 |
| 3 | 07630048 | 0.477982 | 9.19998e-05 | 17.4650 | 07630047 | -0.00680484 | 0.484879 | 17.6590 |