| Red | Green | Blue | |
| z | 17.64 | ||
| znorm | Inf | ||
| sky | -Inf | -Inf | -Inf |
| S/N | 23.0 | 39.9 | 42.3 |
| S/N(c) | 0.0 | 0.0 | 0.0 |
| SN(E/C) |
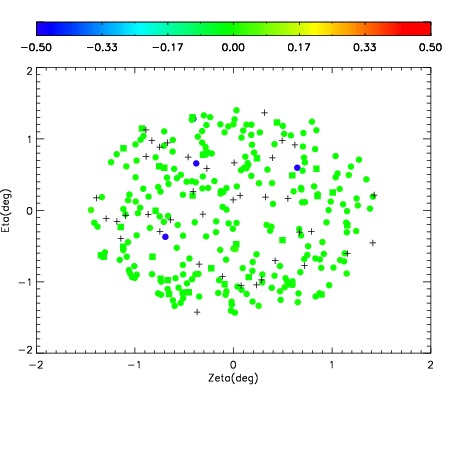
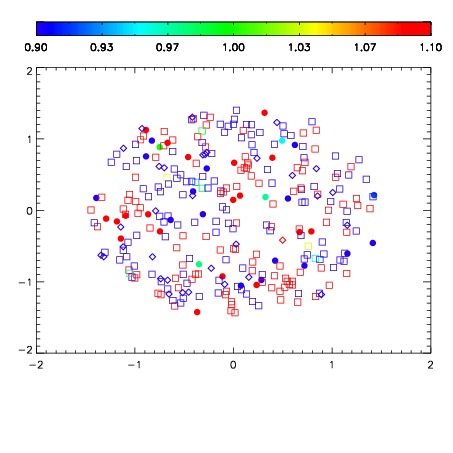


| Frame | Nreads | Zeropoints | Mag plots | Spatial mag deviation | Spatial sky 16325A emission deviations (filled: sky, open: star) | Spatial sky continuum emission | Spatial sky telluric CO2 absorption deviations (filled: H < 10) | |||||||||||||||||||||||
| 0 | 0 |
|
|
|
|
|
|
| IPAIR | NAME | SHIFT | NEWSHIFT | S/N | NAME | SHIFT | NEWSHIFT | S/N |
| 0 | 07920046 | 0.492506 | 0.00000 | 18.8555 | 07920047 | -0.00169096 | 0.494197 | 18.9066 |
| 1 | 07920049 | 0.491148 | 0.00135800 | 18.8634 | 07920051 | -0.00197104 | 0.494477 | 18.9626 |
| 2 | 07920045 | 0.492330 | 0.000175983 | 18.7710 | 07920048 | -0.00370540 | 0.496211 | 18.8183 |
| 3 | 07920050 | 0.492293 | 0.000212997 | 18.6968 | 07920044 | 0.00000 | 0.492506 | 18.7507 |