| Red | Green | Blue | |
| z | 17.63 | ||
| znorm | Inf | ||
| sky | -Inf | -NaN | -Inf |
| S/N | 20.1 | 33.0 | 35.8 |
| S/N(c) | 0.0 | 0.0 | 0.0 |
| SN(E/C) |


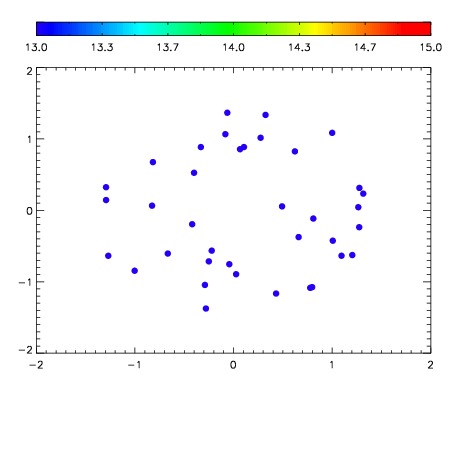

| Frame | Nreads | Zeropoints | Mag plots | Spatial mag deviation | Spatial sky 16325A emission deviations (filled: sky, open: star) | Spatial sky continuum emission | Spatial sky telluric CO2 absorption deviations (filled: H < 10) | |||||||||||||||||||||||
| 0 | 0 |
|
|
|
|
|
|
| IPAIR | NAME | SHIFT | NEWSHIFT | S/N | NAME | SHIFT | NEWSHIFT | S/N |
| 0 | 08180014 | 0.514282 | 0.00000 | 18.9056 | 08180019 | 0.00126583 | 0.513016 | 18.7946 |
| 1 | 08180013 | 0.512034 | 0.00224799 | 18.9373 | 08180012 | 0.00000 | 0.514282 | 18.8801 |
| 2 | 08180018 | 0.512507 | 0.00177497 | 18.5801 | 08180015 | -0.000622284 | 0.514904 | 18.7283 |
| 3 | 08180017 | 0.508085 | 0.00619698 | 18.1483 | 08180016 | -0.00128278 | 0.515565 | 18.6878 |