| Red | Green | Blue | |
| z | 17.64 | ||
| znorm | Inf | ||
| sky | -NaN | -NaN | -Inf |
| S/N | 24.3 | 42.7 | 47.8 |
| S/N(c) | 0.0 | 0.0 | 0.0 |
| SN(E/C) |
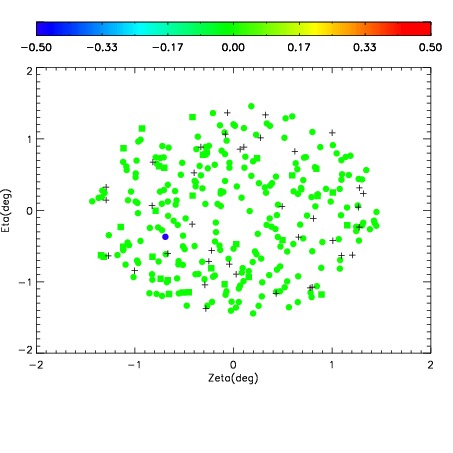
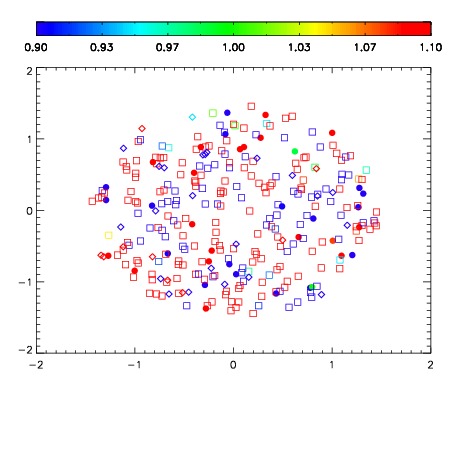
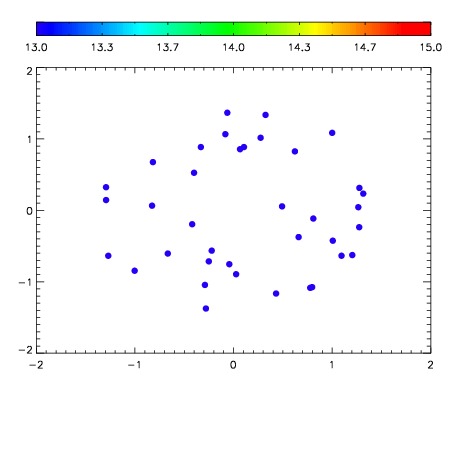

| Frame | Nreads | Zeropoints | Mag plots | Spatial mag deviation | Spatial sky 16325A emission deviations (filled: sky, open: star) | Spatial sky continuum emission | Spatial sky telluric CO2 absorption deviations (filled: H < 10) | |||||||||||||||||||||||
| 0 | 0 |
|
|
|
|
|
|
| IPAIR | NAME | SHIFT | NEWSHIFT | S/N | NAME | SHIFT | NEWSHIFT | S/N |
| 0 | 08410043 | 0.507249 | 0.00000 | 18.9620 | 08410044 | 0.00339012 | 0.503859 | 18.9437 |
| 1 | 08410042 | 0.506431 | 0.000818014 | 18.9576 | 08410040 | -0.000157151 | 0.507406 | 18.9227 |
| 2 | 08410039 | 0.505635 | 0.00161397 | 18.9014 | 08410041 | -0.000883927 | 0.508133 | 18.9078 |
| 3 | 08410038 | 0.505182 | 0.00206697 | 18.8458 | 08410037 | 0.00000 | 0.507249 | 18.8464 |