| Red | Green | Blue | |
| z | 17.64 | ||
| znorm | Inf | ||
| sky | -Inf | -Inf | -Inf |
| S/N | 20.9 | 38.1 | 41.6 |
| S/N(c) | 0.0 | 0.0 | 0.0 |
| SN(E/C) |

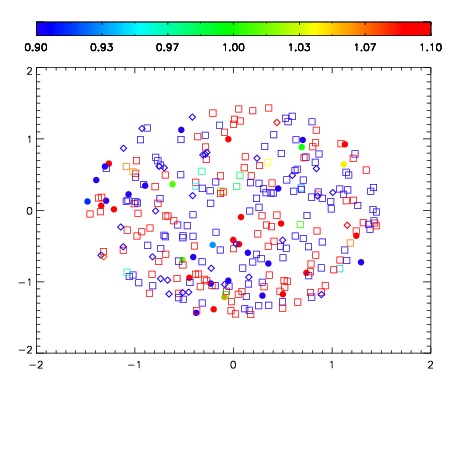


| Frame | Nreads | Zeropoints | Mag plots | Spatial mag deviation | Spatial sky 16325A emission deviations (filled: sky, open: star) | Spatial sky continuum emission | Spatial sky telluric CO2 absorption deviations (filled: H < 10) | |||||||||||||||||||||||
| 0 | 0 |
|
|
|
|
|
|
| IPAIR | NAME | SHIFT | NEWSHIFT | S/N | NAME | SHIFT | NEWSHIFT | S/N |
| 0 | 08150043 | 0.516817 | 0.00000 | 18.8549 | 08150040 | 0.00141959 | 0.515397 | 18.8740 |
| 1 | 08150038 | 0.504507 | 0.0123100 | 18.8558 | 08150044 | 0.00104111 | 0.515776 | 18.9684 |
| 2 | 08150039 | 0.513005 | 0.00381196 | 18.8322 | 08150041 | 0.00210895 | 0.514708 | 18.8540 |
| 3 | 08150042 | 0.505969 | 0.0108480 | 18.7713 | 08150037 | 0.00000 | 0.516817 | 18.8244 |