| Red | Green | Blue | |
| z | 17.64 | ||
| znorm | Inf | ||
| sky | -Inf | -Inf | -Inf |
| S/N | 18.3 | 34.0 | 36.4 |
| S/N(c) | 0.0 | 0.0 | 0.0 |
| SN(E/C) |
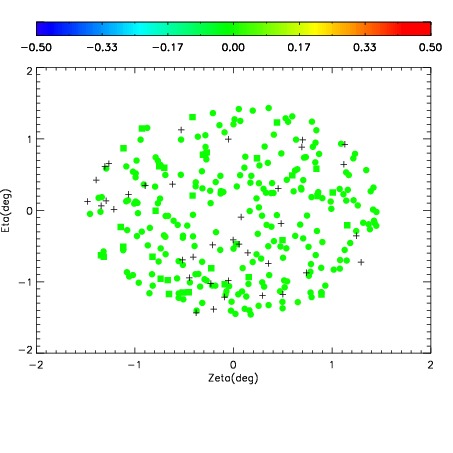
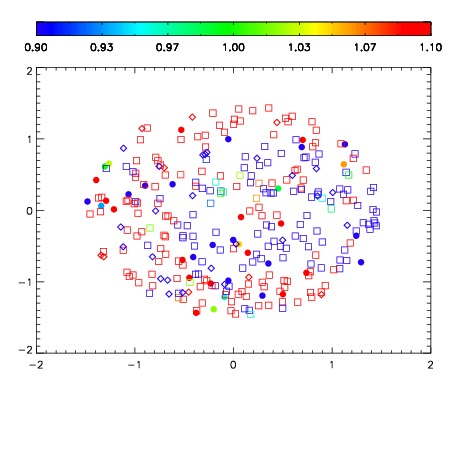


| Frame | Nreads | Zeropoints | Mag plots | Spatial mag deviation | Spatial sky 16325A emission deviations (filled: sky, open: star) | Spatial sky continuum emission | Spatial sky telluric CO2 absorption deviations (filled: H < 10) | |||||||||||||||||||||||
| 0 | 0 |
|
|
|
|
|
|
| IPAIR | NAME | SHIFT | NEWSHIFT | S/N | NAME | SHIFT | NEWSHIFT | S/N |
| 0 | 08210013 | 0.514085 | 0.00000 | 18.1980 | 08210014 | 0.00132634 | 0.512759 | 18.4456 |
| 1 | 08210016 | 0.505917 | 0.00816798 | 18.8771 | 08210018 | 0.000872351 | 0.513213 | 18.9753 |
| 2 | 08210017 | 0.511288 | 0.00279701 | 18.8686 | 08210011 | 0.00000 | 0.514085 | 18.6733 |
| 3 | 08210012 | 0.506139 | 0.00794601 | 18.5700 | 08210015 | 0.000782068 | 0.513303 | 18.6254 |