| Red | Green | Blue | |
| z | 17.64 | ||
| znorm | Inf | ||
| sky | -NaN | -NaN | -Inf |
| S/N | 18.7 | 33.9 | 35.8 |
| S/N(c) | 24.2 | 24.7 | 42.6 |
| SN(E/C) |
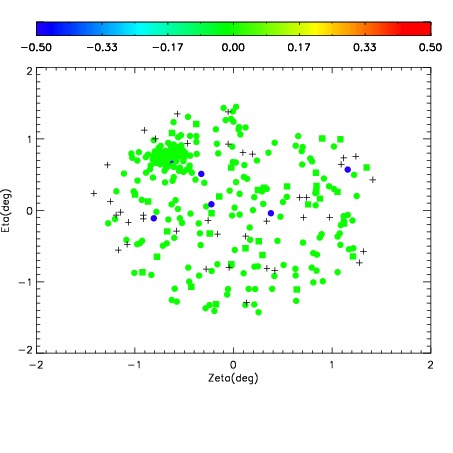
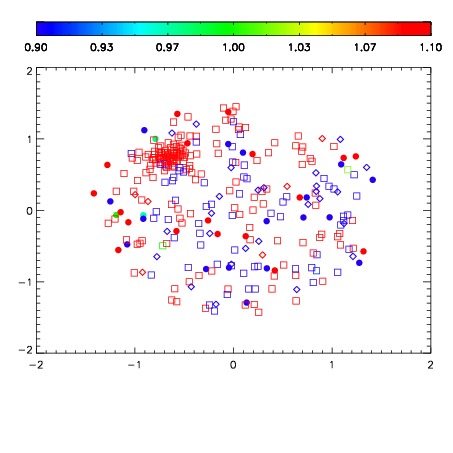
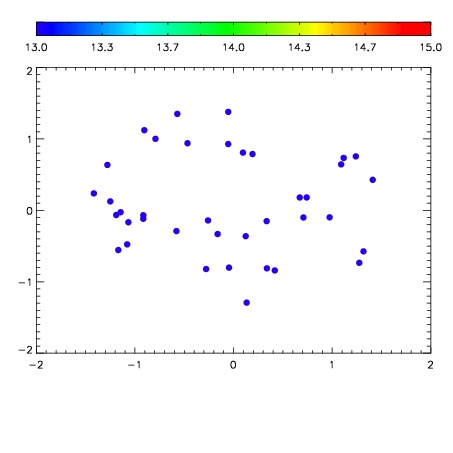

| Frame | Nreads | Zeropoints | Mag plots | Spatial mag deviation | Spatial sky 16325A emission deviations (filled: sky, open: star) | Spatial sky continuum emission | Spatial sky telluric CO2 absorption deviations (filled: H < 10) | |||||||||||||||||||||||
| 0 | 0 |
|
|
|
|
|
|
| IPAIR | NAME | SHIFT | NEWSHIFT | S/N | NAME | SHIFT | NEWSHIFT | S/N |
| 0 | 03740062 | 0.506414 | 0.00000 | 18.9117 | 03740063 | 0.00410188 | 0.502312 | 18.8802 |
| 1 | 03740058 | 0.501617 | 0.00479698 | 18.8647 | 03740059 | 0.00132821 | 0.505086 | 18.8777 |
| 2 | 03740061 | 0.501691 | 0.00472301 | 18.8600 | 03740060 | 0.00160886 | 0.504805 | 18.7930 |
| 3 | 03740057 | 0.498259 | 0.00815499 | 18.7207 | 03740056 | 0.00000 | 0.506414 | 18.6711 |