| Red | Green | Blue | |
| z | 17.64 | ||
| znorm | Inf | ||
| sky | -NaN | -NaN | -Inf |
| S/N | 17.4 | 31.8 | 34.1 |
| S/N(c) | 24.6 | 24.3 | 43.9 |
| SN(E/C) |
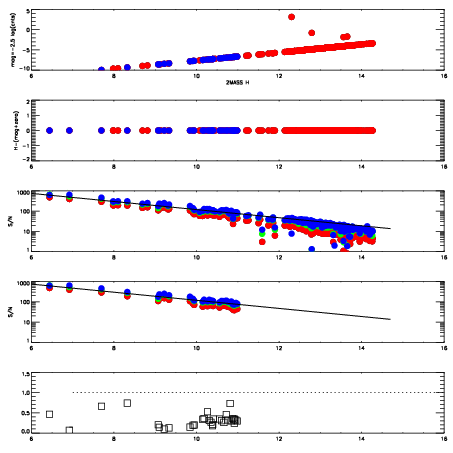
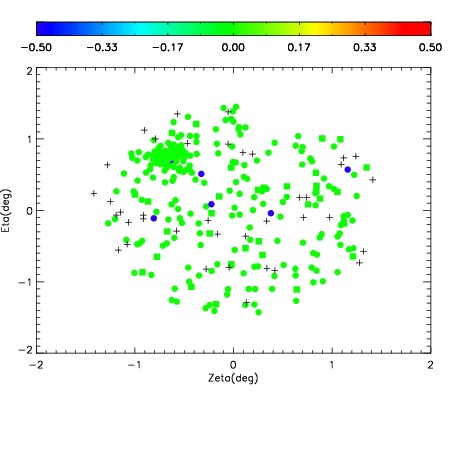
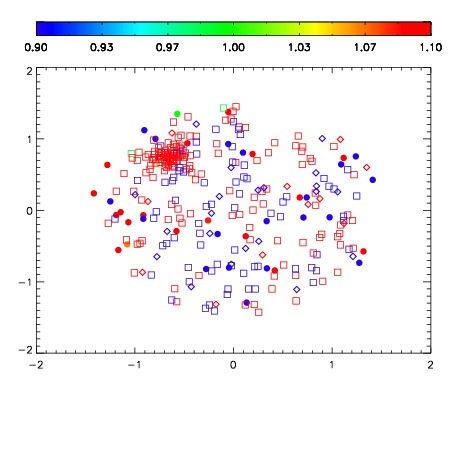
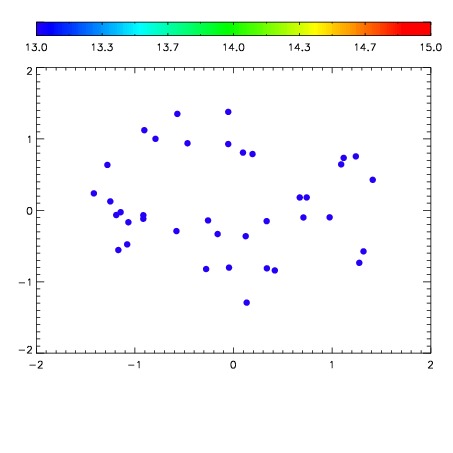

| Frame | Nreads | Zeropoints | Mag plots | Spatial mag deviation | Spatial sky 16325A emission deviations (filled: sky, open: star) | Spatial sky continuum emission | Spatial sky telluric CO2 absorption deviations (filled: H < 10) | |||||||||||||||||||||||
| 0 | 0 |
|
|
|
|
|
|
| IPAIR | NAME | SHIFT | NEWSHIFT | S/N | NAME | SHIFT | NEWSHIFT | S/N |
| 0 | 03750098 | 0.503992 | 0.00000 | 18.8236 | 03750095 | 0.000609665 | 0.503382 | 18.7887 |
| 1 | 03750094 | 0.503294 | 0.000698030 | 18.8884 | 03750099 | 0.00246706 | 0.501525 | 18.8535 |
| 2 | 03750097 | 0.503269 | 0.000723004 | 18.8022 | 03750092 | 0.00000 | 0.503992 | 18.7719 |
| 3 | 03750093 | 0.502082 | 0.00191003 | 18.7313 | 03750096 | -0.000152150 | 0.504144 | 18.7446 |