| Red | Green | Blue | |
| z | 17.64 | ||
| znorm | Inf | ||
| sky | -NaN | -NaN | -Inf |
| S/N | 15.9 | 30.1 | 31.0 |
| S/N(c) | 22.6 | 21.9 | 40.8 |
| SN(E/C) |

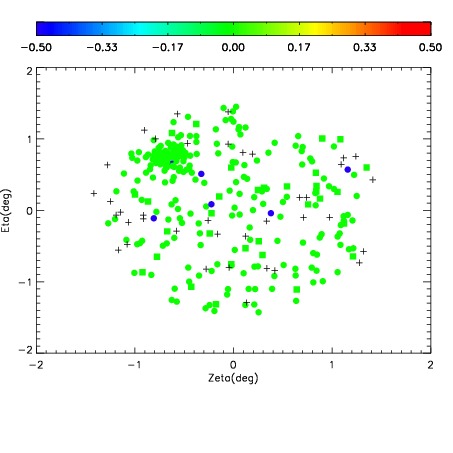
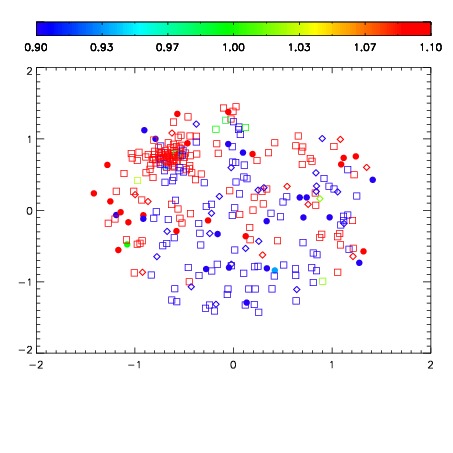
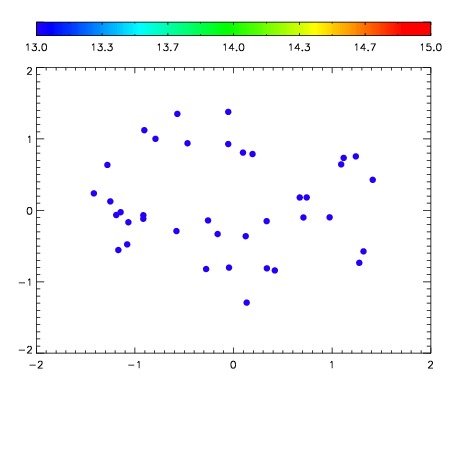

| Frame | Nreads | Zeropoints | Mag plots | Spatial mag deviation | Spatial sky 16325A emission deviations (filled: sky, open: star) | Spatial sky continuum emission | Spatial sky telluric CO2 absorption deviations (filled: H < 10) | |||||||||||||||||||||||
| 0 | 0 |
|
|
|
|
|
|
| IPAIR | NAME | SHIFT | NEWSHIFT | S/N | NAME | SHIFT | NEWSHIFT | S/N |
| 0 | 03760090 | 0.512744 | 0.00000 | 18.4801 | 03760091 | 0.000957277 | 0.511787 | 18.5246 |
| 1 | 03760094 | 0.511319 | 0.00142503 | 18.8426 | 03760095 | 0.00246944 | 0.510275 | 18.9190 |
| 2 | 03760093 | 0.510549 | 0.00219500 | 18.7143 | 03760092 | 0.00167915 | 0.511065 | 18.7317 |
| 3 | 03760089 | 0.512427 | 0.000317037 | 18.4170 | 03760088 | 0.00000 | 0.512744 | 17.9385 |