| Red | Green | Blue | |
| z | 17.64 | ||
| znorm | Inf | ||
| sky | -NaN | -NaN | -Inf |
| S/N | 17.6 | 32.7 | 34.1 |
| S/N(c) | 23.9 | 24.5 | 43.1 |
| SN(E/C) |
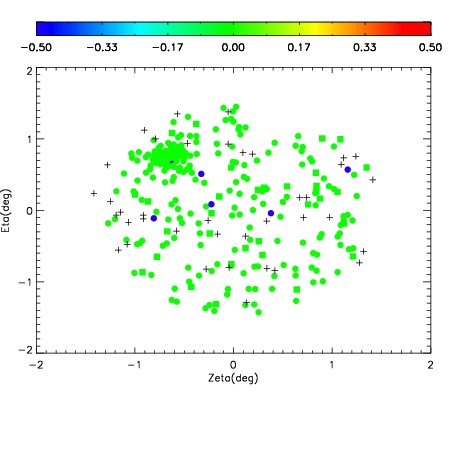
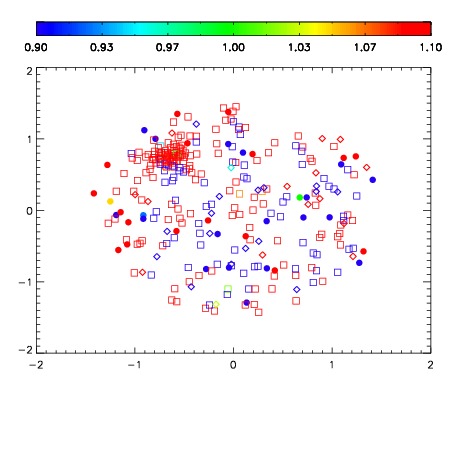
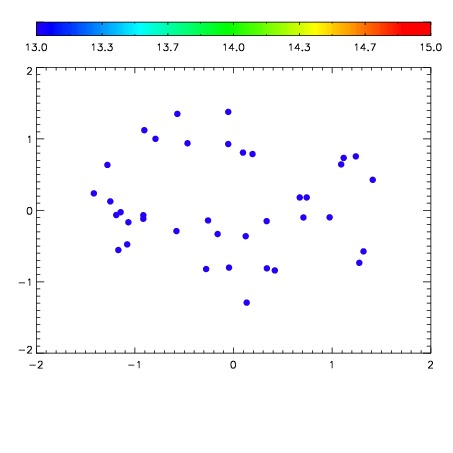

| Frame | Nreads | Zeropoints | Mag plots | Spatial mag deviation | Spatial sky 16325A emission deviations (filled: sky, open: star) | Spatial sky continuum emission | Spatial sky telluric CO2 absorption deviations (filled: H < 10) | |||||||||||||||||||||||
| 0 | 0 |
|
|
|
|
|
|
| IPAIR | NAME | SHIFT | NEWSHIFT | S/N | NAME | SHIFT | NEWSHIFT | S/N |
| 0 | 03770064 | 0.510672 | 0.00000 | 18.7370 | 03770058 | 0.00000 | 0.510672 | 18.7668 |
| 1 | 03770060 | 0.507376 | 0.00329596 | 18.9052 | 03770065 | 0.00639233 | 0.504280 | 18.8598 |
| 2 | 03770063 | 0.509450 | 0.00122195 | 18.8091 | 03770061 | 0.00259555 | 0.508076 | 18.8025 |
| 3 | 03770059 | 0.507382 | 0.00329000 | 18.7837 | 03770062 | 0.00363619 | 0.507036 | 18.7754 |