| Red | Green | Blue | |
| z | 17.63 | ||
| znorm | Inf | ||
| sky | -NaN | -NaN | -Inf |
| S/N | 24.3 | 44.1 | 46.0 |
| S/N(c) | 31.3 | 32.5 | 56.3 |
| SN(E/C) |
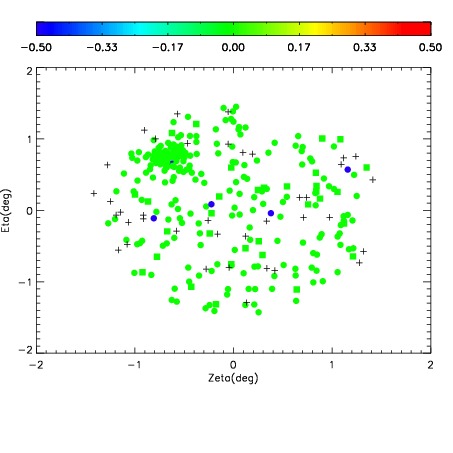
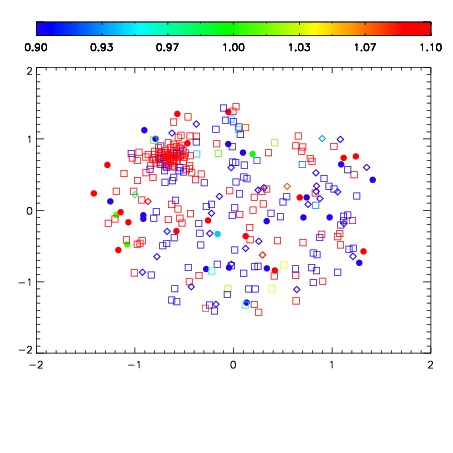
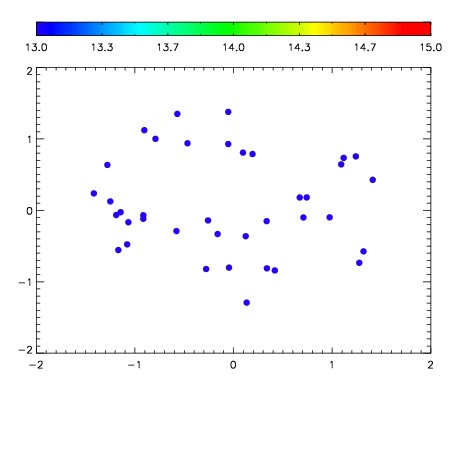

| Frame | Nreads | Zeropoints | Mag plots | Spatial mag deviation | Spatial sky 16325A emission deviations (filled: sky, open: star) | Spatial sky continuum emission | Spatial sky telluric CO2 absorption deviations (filled: H < 10) | |||||||||||||||||||||||
| 0 | 0 |
|
|
|
|
|
|
| IPAIR | NAME | SHIFT | NEWSHIFT | S/N | NAME | SHIFT | NEWSHIFT | S/N |
| 0 | 03780068 | 0.509830 | 0.00000 | 19.0427 | 03780069 | 0.00226770 | 0.507562 | 19.0087 |
| 1 | 03780067 | 0.508756 | 0.00107402 | 18.9992 | 03780066 | 0.000509293 | 0.509321 | 19.0034 |
| 2 | 03780064 | 0.508353 | 0.00147700 | 18.9044 | 03780065 | 0.000367925 | 0.509462 | 18.9485 |
| 3 | 03780063 | 0.507628 | 0.00220197 | 18.8084 | 03780062 | 0.000406603 | 0.509423 | 18.7916 |
| 4 | 03780059 | 0.504995 | 0.00483501 | 18.7252 | 03780058 | 0.00000 | 0.509830 | 18.7888 |
| 5 | 03780060 | 0.506102 | 0.00372797 | 18.6923 | 03780061 | 8.30998e-05 | 0.509747 | 18.7756 |