| Red | Green | Blue | |
| z | 17.64 | ||
| znorm | Inf | ||
| sky | -Inf | -Inf | -Inf |
| S/N | 16.1 | 28.4 | 31.0 |
| S/N(c) | 15.3 | 24.8 | 14.1 |
| SN(E/C) |


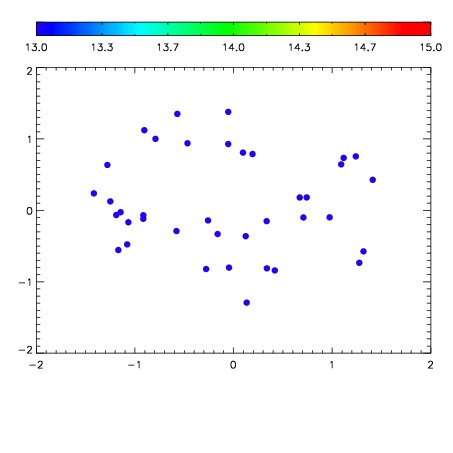

| Frame | Nreads | Zeropoints | Mag plots | Spatial mag deviation | Spatial sky 16325A emission deviations (filled: sky, open: star) | Spatial sky continuum emission | Spatial sky telluric CO2 absorption deviations (filled: H < 10) | |||||||||||||||||||||||
| 0 | 0 |
|
|
|
|
|
|
| IPAIR | NAME | SHIFT | NEWSHIFT | S/N | NAME | SHIFT | NEWSHIFT | S/N |
| 0 | 04880028 | 0.498270 | 0.00000 | 16.8282 | 04880033 | 0.00254918 | 0.495721 | 17.9103 |
| 1 | 04880031 | 0.496214 | 0.00205600 | 18.7271 | 04880029 | 0.000338620 | 0.497931 | 18.6667 |
| 2 | 04880032 | 0.497268 | 0.00100201 | 18.5183 | 04880030 | 0.000489171 | 0.497781 | 18.3029 |
| 3 | 04880027 | 0.497317 | 0.000953019 | 16.9487 | 04880026 | 0.00000 | 0.498270 | 18.0677 |