| Red | Green | Blue | |
| z | 17.64 | ||
| znorm | Inf | ||
| sky | -Inf | -Inf | -Inf |
| S/N | 25.4 | 43.2 | 45.0 |
| S/N(c) | 25.7 | 39.5 | 22.2 |
| SN(E/C) |

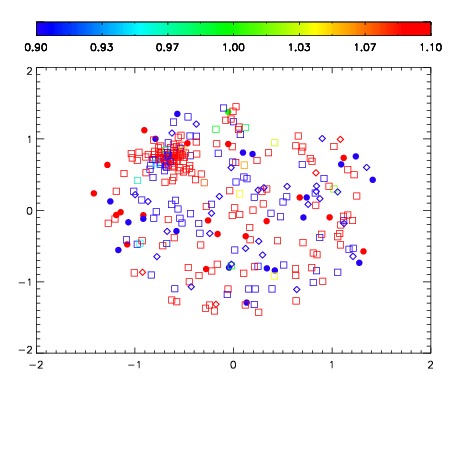


| Frame | Nreads | Zeropoints | Mag plots | Spatial mag deviation | Spatial sky 16325A emission deviations (filled: sky, open: star) | Spatial sky continuum emission | Spatial sky telluric CO2 absorption deviations (filled: H < 10) | |||||||||||||||||||||||
| 0 | 0 |
|
|
|
|
|
|
| IPAIR | NAME | SHIFT | NEWSHIFT | S/N | NAME | SHIFT | NEWSHIFT | S/N |
| 0 | 04890027 | 0.492289 | 0.00000 | 18.9278 | 04890028 | 0.00268734 | 0.489602 | 18.9320 |
| 1 | 04890031 | 0.492038 | 0.000250995 | 18.9896 | 04890029 | 0.000472790 | 0.491816 | 18.9709 |
| 2 | 04890030 | 0.489996 | 0.00229302 | 18.9861 | 04890032 | 0.00273099 | 0.489558 | 18.9528 |
| 3 | 04890026 | 0.491327 | 0.000962019 | 18.9101 | 04890025 | 0.00000 | 0.492289 | 18.8267 |