| Red | Green | Blue | |
| z | 17.64 | ||
| znorm | Inf | ||
| sky | -Inf | -Inf | -Inf |
| S/N | 23.9 | 40.8 | 44.5 |
| S/N(c) | 24.8 | 38.5 | 21.4 |
| SN(E/C) |
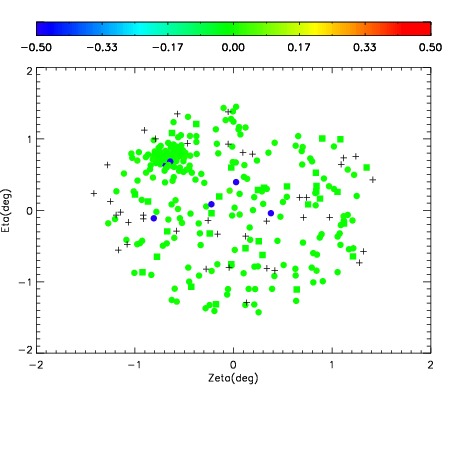
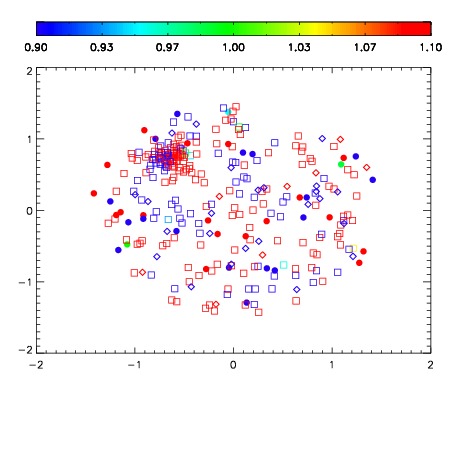
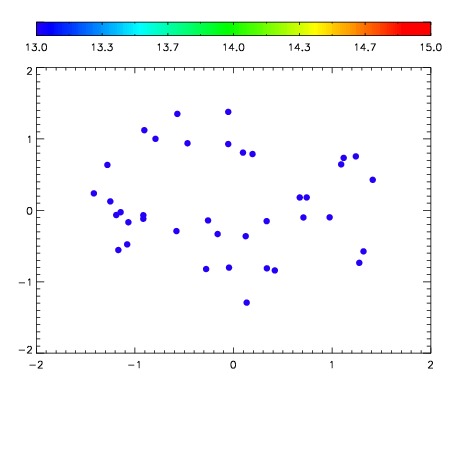

| Frame | Nreads | Zeropoints | Mag plots | Spatial mag deviation | Spatial sky 16325A emission deviations (filled: sky, open: star) | Spatial sky continuum emission | Spatial sky telluric CO2 absorption deviations (filled: H < 10) | |||||||||||||||||||||||
| 0 | 0 |
|
|
|
|
|
|
| IPAIR | NAME | SHIFT | NEWSHIFT | S/N | NAME | SHIFT | NEWSHIFT | S/N |
| 0 | 04900031 | 0.487991 | 0.00000 | 18.9423 | 04900029 | 0.00144490 | 0.486546 | 18.9637 |
| 1 | 04900030 | 0.486719 | 0.00127199 | 18.8538 | 04900032 | 0.00268758 | 0.485303 | 18.9417 |
| 2 | 04900027 | 0.486337 | 0.00165400 | 18.8147 | 04900028 | 0.00144262 | 0.486548 | 18.9175 |
| 3 | 04900026 | 0.486014 | 0.00197700 | 18.4781 | 04900025 | 0.00000 | 0.487991 | 18.6048 |