| Red | Green | Blue | |
| z | 17.64 | ||
| znorm | Inf | ||
| sky | -Inf | -Inf | -Inf |
| S/N | 28.4 | 48.0 | 53.7 |
| S/N(c) | 30.9 | 22.6 | 80.0 |
| SN(E/C) |
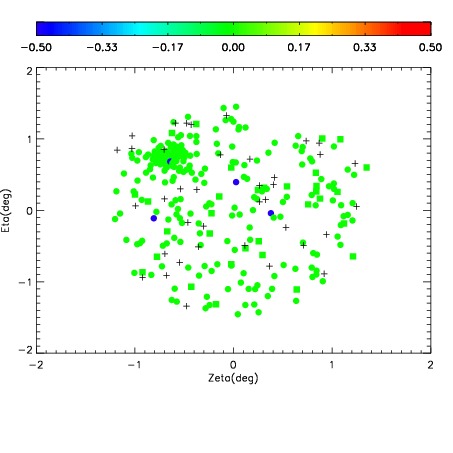
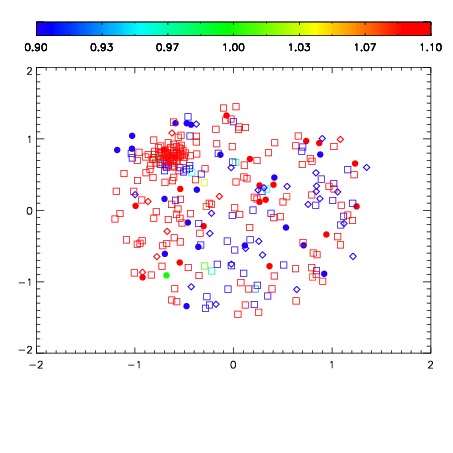


| Frame | Nreads | Zeropoints | Mag plots | Spatial mag deviation | Spatial sky 16325A emission deviations (filled: sky, open: star) | Spatial sky continuum emission | Spatial sky telluric CO2 absorption deviations (filled: H < 10) | |||||||||||||||||||||||
| 0 | 0 |
|
|
|
|
|
|
| IPAIR | NAME | SHIFT | NEWSHIFT | S/N | NAME | SHIFT | NEWSHIFT | S/N |
| 0 | 05150034 | 0.499708 | 0.00000 | 19.1551 | 05150035 | 0.00417693 | 0.495531 | 19.1383 |
| 1 | 05150030 | 0.498430 | 0.00127798 | 19.1617 | 05150031 | 0.00122542 | 0.498483 | 19.1556 |
| 2 | 05150029 | 0.497409 | 0.00229901 | 19.1281 | 05150032 | 0.00192335 | 0.497785 | 19.1212 |
| 3 | 05150033 | 0.499272 | 0.000436008 | 19.1207 | 05150028 | 0.00000 | 0.499708 | 19.1163 |