| Red | Green | Blue | |
| z | 17.64 | ||
| znorm | Inf | ||
| sky | -Inf | -Inf | -Inf |
| S/N | 28.3 | 45.8 | 48.8 |
| S/N(c) | 29.6 | 21.8 | 73.4 |
| SN(E/C) |

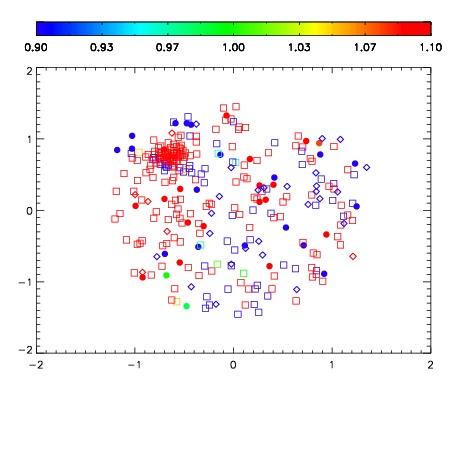


| Frame | Nreads | Zeropoints | Mag plots | Spatial mag deviation | Spatial sky 16325A emission deviations (filled: sky, open: star) | Spatial sky continuum emission | Spatial sky telluric CO2 absorption deviations (filled: H < 10) | |||||||||||||||||||||||
| 0 | 0 |
|
|
|
|
|
|
| IPAIR | NAME | SHIFT | NEWSHIFT | S/N | NAME | SHIFT | NEWSHIFT | S/N |
| 0 | 05160016 | 0.495760 | 0.00000 | 18.9953 | 05160017 | 0.00156090 | 0.494199 | 18.9426 |
| 1 | 05160015 | 0.493740 | 0.00202000 | 19.0691 | 05160013 | 0.000635198 | 0.495125 | 19.0553 |
| 2 | 05160012 | 0.495708 | 5.20051e-05 | 19.0681 | 05160014 | -0.000810704 | 0.496571 | 19.0394 |
| 3 | 05160011 | 0.494875 | 0.000884980 | 19.0490 | 05160010 | 0.00000 | 0.495760 | 19.0185 |