| Red | Green | Blue | |
| z | 17.63 | ||
| znorm | Inf | ||
| sky | -NaN | -NaN | -Inf |
| S/N | 32.7 | 56.8 | 64.0 |
| S/N(c) | 0.0 | 0.0 | 0.0 |
| SN(E/C) |
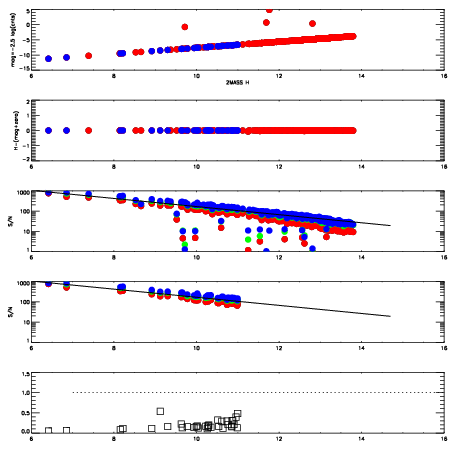

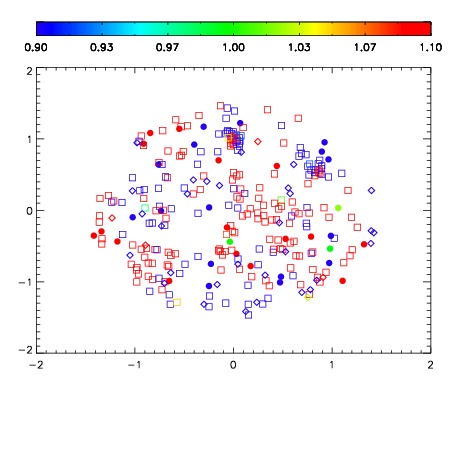
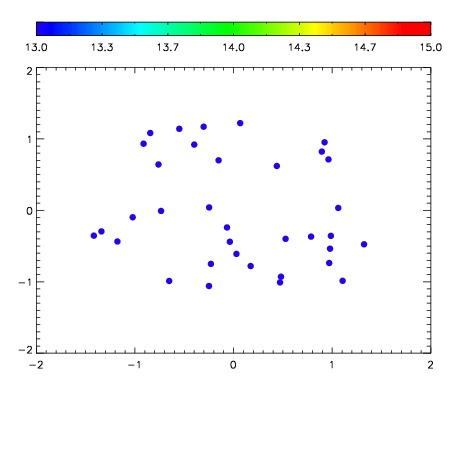

| Frame | Nreads | Zeropoints | Mag plots | Spatial mag deviation | Spatial sky 16325A emission deviations (filled: sky, open: star) | Spatial sky continuum emission | Spatial sky telluric CO2 absorption deviations (filled: H < 10) | |||||||||||||||||||||||
| 0 | 0 |
|
|
|
|
|
|
| IPAIR | NAME | SHIFT | NEWSHIFT | S/N | NAME | SHIFT | NEWSHIFT | S/N |
| 0 | 03700095 | 0.508133 | 0.00000 | 18.8833 | 03700101 | -0.000226992 | 0.508360 | 18.9622 |
| 1 | 03700107 | 0.498562 | 0.00957099 | 19.1169 | 03700108 | 0.000993838 | 0.507139 | 19.1170 |
| 2 | 03700106 | 0.496616 | 0.0115170 | 19.1057 | 03700104 | -6.22612e-05 | 0.508195 | 19.0786 |
| 3 | 03700103 | 0.499269 | 0.00886399 | 19.0684 | 03700105 | 0.00141856 | 0.506714 | 19.0427 |
| 4 | 03700102 | 0.499596 | 0.00853699 | 19.0270 | 03700097 | 0.000984930 | 0.507148 | 19.0417 |
| 5 | 03700098 | 0.498412 | 0.00972098 | 19.0041 | 03700096 | 0.000193639 | 0.507939 | 18.9983 |
| 6 | 03700099 | 0.504210 | 0.00392300 | 18.9682 | 03700100 | 0.000379843 | 0.507753 | 18.9812 |
| 7 | 03700094 | 0.503933 | 0.00419998 | 18.8825 | 03700093 | 0.00000 | 0.508133 | 18.6799 |