| Red | Green | Blue | |
| z | 17.64 | ||
| znorm | Inf | ||
| sky | -NaN | -NaN | -Inf |
| S/N | 29.7 | 50.1 | 55.9 |
| S/N(c) | 0.0 | 0.0 | 0.0 |
| SN(E/C) |
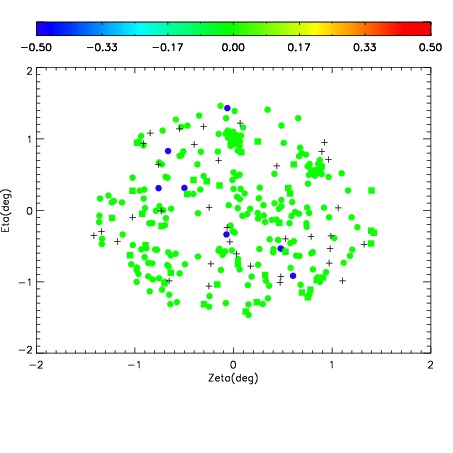

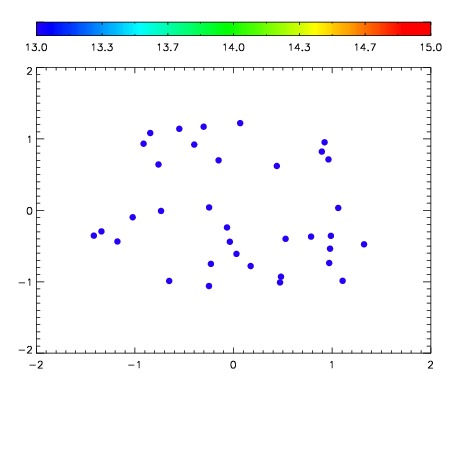

| Frame | Nreads | Zeropoints | Mag plots | Spatial mag deviation | Spatial sky 16325A emission deviations (filled: sky, open: star) | Spatial sky continuum emission | Spatial sky telluric CO2 absorption deviations (filled: H < 10) | |||||||||||||||||||||||
| 0 | 0 |
|
|
|
|
|
|
| IPAIR | NAME | SHIFT | NEWSHIFT | S/N | NAME | SHIFT | NEWSHIFT | S/N |
| 0 | 04030090 | 0.500332 | 0.00000 | 19.1313 | 04030091 | 0.000840881 | 0.499491 | 19.1157 |
| 1 | 04030089 | 0.499642 | 0.000689983 | 19.1738 | 04030088 | 0.00000 | 0.500332 | 19.1525 |
| 2 | 04030097 | 0.498500 | 0.00183201 | 19.1078 | 04030095 | 0.00379837 | 0.496534 | 19.0924 |
| 3 | 04030094 | 0.498573 | 0.00175899 | 19.0541 | 04030092 | 0.000523404 | 0.499809 | 19.0893 |
| 4 | 04030093 | 0.498133 | 0.00219899 | 19.0224 | 04030096 | 0.00204759 | 0.498284 | 19.0758 |