| Red | Green | Blue | |
| z | 17.64 | ||
| znorm | Inf | ||
| sky | -NaN | -Inf | -Inf |
| S/N | 22.7 | 40.7 | 43.4 |
| S/N(c) | 0.0 | 0.0 | 0.0 |
| SN(E/C) |
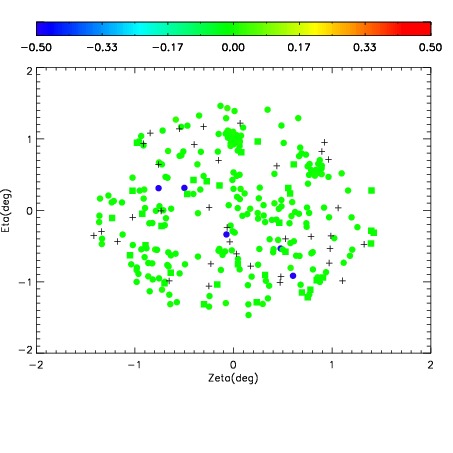
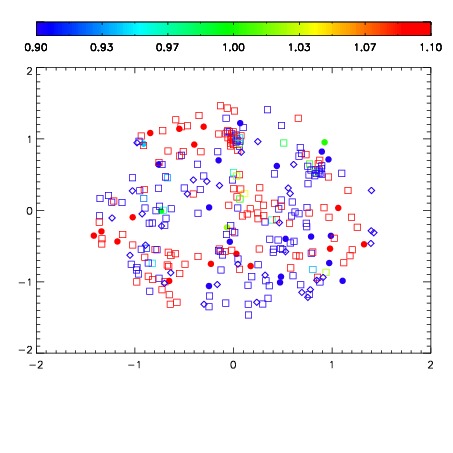
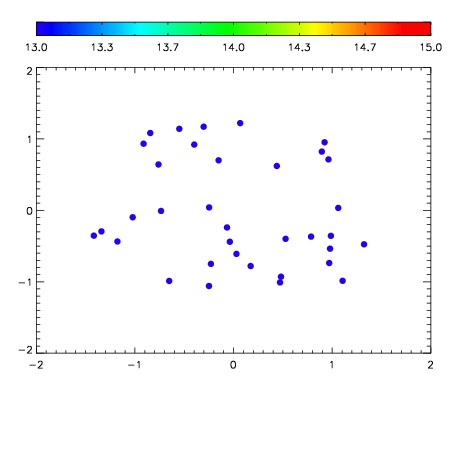

| Frame | Nreads | Zeropoints | Mag plots | Spatial mag deviation | Spatial sky 16325A emission deviations (filled: sky, open: star) | Spatial sky continuum emission | Spatial sky telluric CO2 absorption deviations (filled: H < 10) | |||||||||||||||||||||||
| 0 | 0 |
|
|
|
|
|
|
| IPAIR | NAME | SHIFT | NEWSHIFT | S/N | NAME | SHIFT | NEWSHIFT | S/N |
| 0 | 04280080 | 0.499898 | 0.00000 | 19.0124 | 04280081 | 0.00151897 | 0.498379 | 18.8957 |
| 1 | 04280079 | 0.492303 | 0.00759497 | 18.9554 | 04280074 | 0.00000 | 0.499898 | 18.7757 |
| 2 | 04280075 | 0.492961 | 0.00693700 | 18.7055 | 04280077 | 0.00115775 | 0.498740 | 18.7417 |
| 3 | 04280076 | 0.496470 | 0.00342798 | 18.6209 | 04280078 | 0.000528697 | 0.499369 | 18.7089 |